📦
Building tidy tools
Day 2 Session 3: Tidy Eval
Invalid Date
Learning objectives
At the end of this section you will be able to:
- build functions that call tidyverse functions, using bare-name arguments:
- designed for interactive use, i.e. like
dplyr::filter()
- designed for interactive use, i.e. like
- understand terms: data masking, tidy select, dynamic dots
- recognize other ways to use tidy eval:
- functions that call tidyverse functions using string-based arguments, i.e. for use with Shiny.
- correspondence with techniques used for bare-name arguments.
Source material
Vignettes:
Motivation for tidy eval
Tidy eval (and non-standard evaluation generally in R) exists so that we can refer to data columns using bare names.
dplyr::filter(mtcars, cyl == 4)- It makes things easier if you are working interactively.
- It makes things more interesting if you are writing functions.
Welcome to more interesting.
Families of tidy-eval functions
There are two families of tidy-eval functions:
-
data-masking: evaluate variables in context of data frame
mtcars |>
  dplyr::mutate(wt_kg = wt * 1000 / 2.2)
-
tidy-select: specify columns within a data frame
mtcars |>
  dplyr::select(starts_with("w"))
Ways to express tidy-eval
-
using bare names, what we do in interactive programming:
mtcars |>
  dplyr::mutate(wt_kg = wt * 1000 / 2.2)
-
using strings, useful for Shiny :
mtcars |>
  dplyr::mutate("wt_kg" := .data[["wt"]] * 1000 / 2.2)
Goal
Write functions that:
- call tidyverse functions, e.g.
dplyr::filter() - “look and feel” like tidyverse functions:
- your users can call using bare names
- use string-techniques when we know the column names
Out of scope:
- underlying theory of quasiquotation, i.e.
rlang::quo(),rlang::enquo(),rlang::eval_tidy()
Pass the dots
This is the simplest possible solution.
- If the tidyverse function you’re using takes
...as an argument,
- and that’s what you want to pass along,
then you can pass the dots.
my_select <- function(.data, ...) {
  dplyr::select(.data, ...)
}
Our turn "2.3.1"
Only if needed,
btt22::btt_reset_hard("2.3.1")
No new files.
Goal
uss_get_matches() to use dplyr::filter():
uss_get_matches("italy", season == 1929)equivalent to:
uss_get_matches("italy") |>
  dplyr::filter(season == 1929)
Pass the dots to filter() results
In uss_get_matches():
Add
...to the formal arguments.Pass the dots to
dplyr::filter().-
Document:
- use
#' @inheritParams dplyr::filter - add example
- add to package vignette
- use
Add test (
usethis::use_test())
Pronouns: .data, .env
[1] 32[1] 11[1] 11Pronouns: .data, .env (cont.)
[1] 11[1] 32[1] 11Pronouns
The .data and .env pronouns are provided by {rlang} (Henry and Wickham 2022a).
For data-masking functions, make explicit how to evaluate variables.
To use them in your package:
usethis::use_import_from("rlang", c(".data", ".env"))Our turn "2.3.2"
Only if needed,
btt22::btt_reset_hard("2.3.2")
Get new files, btt22::btt_get("2.3.2"):
teams-matches.Rtest-teams-matches.R
Teams-matches
matches: one row per match played
# A tibble: 1 × 8
  country tier  season date       home     visitor    goals_home goals_visitor
  <chr>   <fct>  <int> <date>     <chr>    <chr>           <int>         <int>
1 Italy 1 1929 1929-10-06 Juventus SSC Napoli 3 2teams-matches: one row per team playing a match
uss_make_teams_matches():
- takes a matches data frame
- returns a teams-matches data frame
Try out new code
go through code, tests
document(),test(),check(),install()
italy_teams_matches <-
  uss_get_matches("italy") |>
uss_make_teams_matches()- next few exercises, just modify code
Use .env pronoun
at_home <- FALSE

teams_matches_visitor <-
  data_matches |>
  dplyr::rename(
    team = "visitor",
    opponent = "home",
    goals_against = "goals_home",
    goals_for = "goals_visitor"
  ) |>
  dplyr::mutate(at_home = FALSE)
instead of
FALSE, use.env$at_home.
Splicing: !!!
Used to splice a list or vector into a ... argument.
If you know JavaScript, it’s like the destructuring operator.
It works only with dynamic dots (a tidyverse construct).
!!! reflects ...
!!! evaluates the variable using the environment
Our turn "2.3.3"
Only if needed,
btt22::btt_reset_hard("2.3.3")
No new files.
Goal
Use splice operator, !!!
Splice renaming
teams_matches_home <-
  data_matches |>
  dplyr::rename(
    team = "home",
    opponent = "visitor",
    goals_for = "goals_home",
    goals_against = "goals_visitor"
  ) |>
  dplyr::mutate(at_home = TRUE)
look at
rename_home()andrename_visitor().Use
!!!withteams_matches_home(),_visitor().
New columns
With dynamic dots you can name new columns using variables.
prefix <- "new"

mtcars |>
  dplyr::rename("{prefix}_mpg" := "mpg")
Two things to keep in mind:
- left side of expression is a {glue}-enabled string.
- operator is
:=, not=.
To use in your package:
usethis::use_import_from("rlang", ":=")Our turn "2.3.4"
Only if needed,
btt22::btt_reset_hard("2.3.4")
No new files.
usethis::use_import_from("rlang", ":=")
Goal
Use naming operator, :=
Naming columns
name_of_at_home <- "at_home"
teams_matches_visitor <-
  data_matches |>
  dplyr::rename(!!!rename_visitor()) |>
  dplyr::mutate(at_home = FALSE)
use
name_of_at_hometo name column inmutate()
Remember:
- left side of expression is a {glue}-enabled string
- operator is
:=, not=
dplyr::across(): super useful
used inside data-masking verbs, e.g.
summarise()-
specify:
which columns to consider, using tidy-select
what function(s), if any, to apply
Tidy-select and ambiguity
all_of(), any_of()
Exported by {dplyr} (Wickham et al. 2022); part of {tidyselect} (Henry and Wickham 2022b)
Used to disambiguate external- vector of column names:
placeholder <- c("wt", "mpg", "not_in_mtcars")Our turn "2.3.5"
Only if needed,
btt22::btt_reset_hard("2.3.5")
No new files.
Goal
Arrange teams-matches by country, tier, season, team, date.
dplyr::arrange() is a data-masking function.
We want to supply the columns using tidy-select.
Use dplyr::across().
uss_make_teams_matches()
Let’s add some code near the end to arrange the rows:
result <-
  teams_matches_home |>
  dplyr::bind_rows(teams_matches_visitor) |>
  dplyr::select(cols_teams_matches()) |>
  dplyr::arrange(
    dplyr::across(
      c("country", "tier", "season", "team", "date")
    )
  )
Not using variable-names in tidy-select that could be confused for column-names; we don’t need all_of().
Accepting new snapshot
-
devtools::test()changes the snapshot test
snapshot_review('teams-matches')
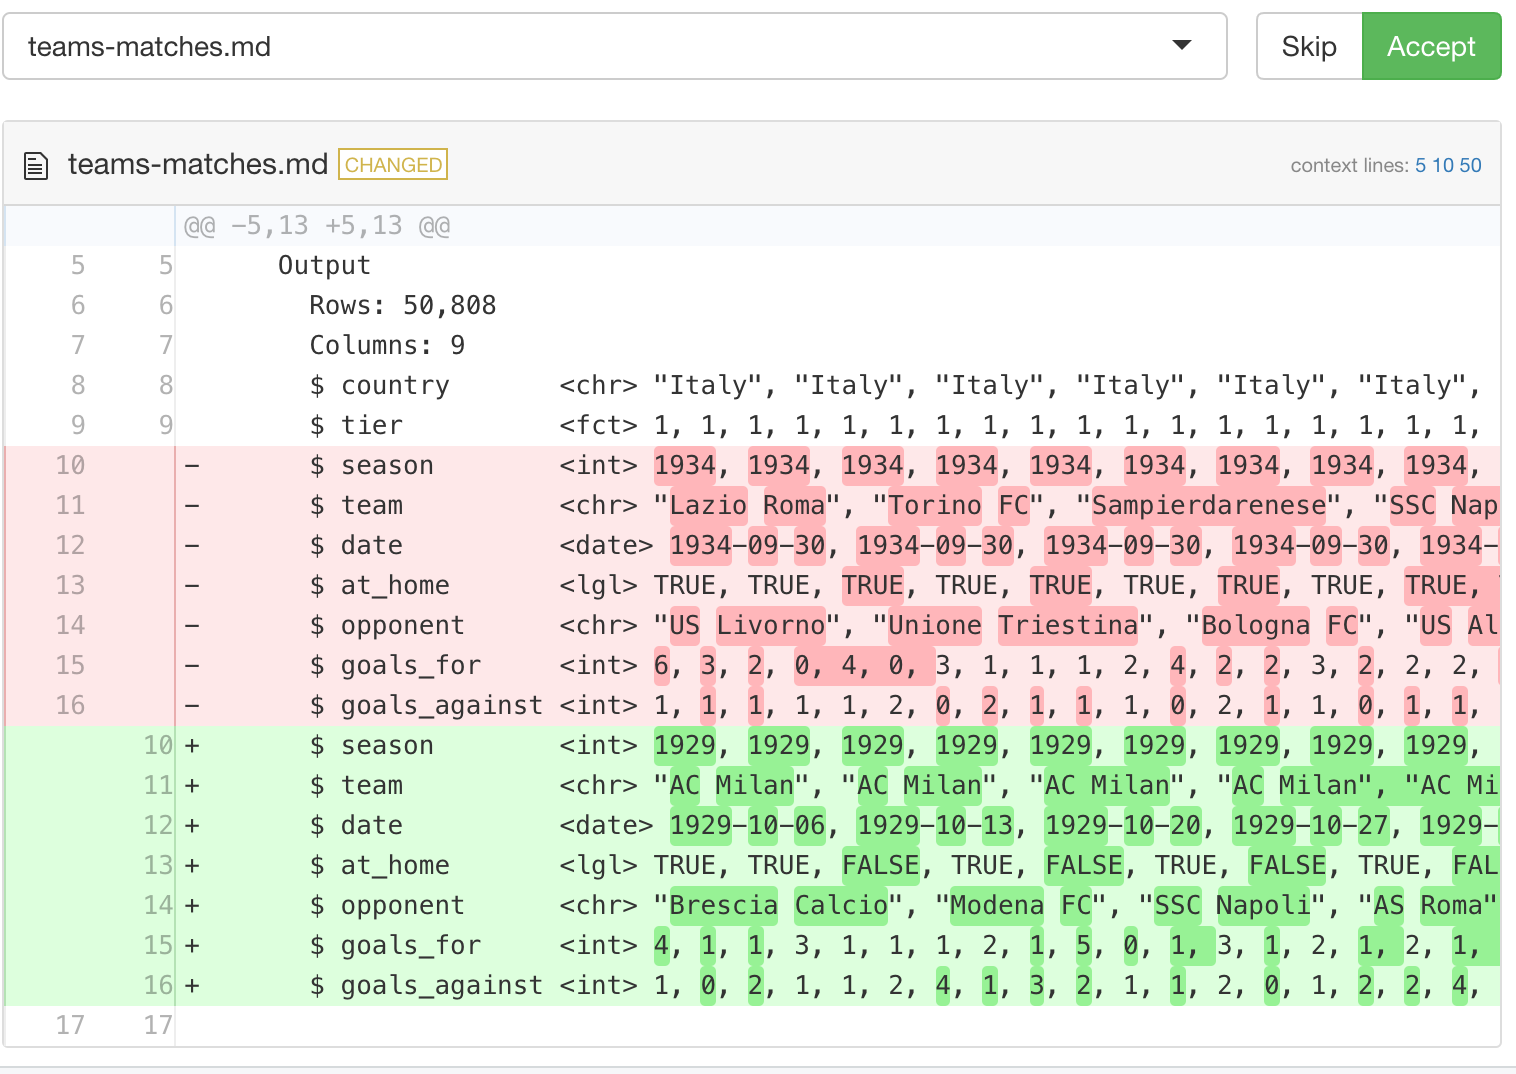
accept the change
Our turn "2.3.6"
Only if needed,
btt22::btt_reset_hard("2.3.6")
Get new files, btt22::btt_get("2.3.6"):
-
points.R,seasons.R -
test-points.R,test-seasons.R
Used to aggregate performance over seasons.
Aggregating seasons
uss_make_seasons_cumulative() takes a teams-matches data frame:
# A tibble: 612 × 9
   country tier  season team     date       at_home opponent       goals_for goals_against
   <chr>   <fct>  <int> <chr>    <date>     <lgl>   <chr>              <int>         <int>
 1 Italy   1       1929 AC Milan 1929-10-06 TRUE    Brescia Calcio         4             1
 2 Italy   1       1929 AC Milan 1929-10-13 TRUE    Modena FC              1             0
 3 Italy   1       1929 AC Milan 1929-10-20 FALSE   SSC Napoli             1             2
and returns a seasons data frame:
# A tibble: 612 × 12
# Groups:   country, tier, season, team [18]
   country tier  season team     date       matches  wins draws losses points goals_for goals_against
   <chr>   <fct>  <int> <chr>    <date>       <int> <int> <int>  <int>  <int>     <int>         <int>
 1 Italy   1       1929 AC Milan 1929-10-06       1     1     0      0      2         4             1
 2 Italy   1       1929 AC Milan 1929-10-13       2     2     0      0      4         5             1
 3 Italy   1       1929 AC Milan 1929-10-20       3     2     0      1      4         6             3
This form is cumulative.
Season final results
We need to build a function to take a teams-matches data frame:
# A tibble: 612 × 9
   country tier  season team     date       at_home opponent       goals_for goals_against
   <chr>   <fct>  <int> <chr>    <date>     <lgl>   <chr>              <int>         <int>
 1 Italy   1       1929 AC Milan 1929-10-06 TRUE    Brescia Calcio         4             1
 2 Italy   1       1929 AC Milan 1929-10-13 TRUE    Modena FC              1             0
 3 Italy   1       1929 AC Milan 1929-10-20 FALSE   SSC Napoli             1             2
and return a seasons data frame:
# A tibble: 18 × 12
# Groups:   country, tier, season, team [18]
   country tier  season team        date       matches  wins draws losses points goals_for goals_against
   <chr>   <fct>  <int> <chr>       <date>       <int> <int> <int>  <int>  <int>     <int>         <int>
 1 Italy   1       1929 Inter       1930-07-06      34    22     6      6     50        85            38
 2 Italy   1       1929 Genova 189… 1930-07-06      34    20     8      6     48        63            39
 3 Italy   1       1929 Juventus    1930-07-06      34    19     7      8     45        56            31
This form is final.
Season: intermediate form
Both the cumulative and the final can be derived from the same intermediate form:
# A tibble: 612 × 12
# Groups:   country, tier, season, team [18]
   country tier  season team     date       matches wins  draws losses points goals_for goals_against
   <chr>   <fct>  <int> <chr>    <date>     <lgl>   <lgl> <lgl> <lgl>   <int>     <int>         <int>
 1 Italy   1       1929 AC Milan 1929-10-06 TRUE    TRUE  FALSE FALSE       2         4             1
 2 Italy   1       1929 AC Milan 1929-10-13 TRUE    TRUE  FALSE FALSE       2         1             0
3 Italy 1 1929 AC Milan 1929-10-20 TRUE FALSE FALSE TRUE 0 1 2group_by(): country, tier, season, team
cumulative:
- keep
date,cumsum():matches,wins,draws, …
final:
- max
date,sum():matches,wins,draws, …
Try out new code
go through code, tests
document(),test(),check(),install()
italy_1929 <-
  uss_get_matches("italy", season == 1929) |>
  uss_make_teams_matches() |>
  uss_make_seasons_cumulative()
uss_make_seasons_final()
-
same args as
uss_make_seasons_cumulative()#' @rdname uss_make_seasons_cumulative #' @export same validation, test by uncommenting
use
dplyr::summarise(), vs.dplyr::mutate()sumquantities, rather thancumsumsummarise()thedatedifferentlyadd example, add to vignette
Curly-curly: {{}}
glue lets you interpolate strings:
greet <- function(name) {
  glue::glue("Hello {name}")
}greet("there")Tidy eval lets you interpolate arguments:
mutate_greet <- function(.data, greeting) {
  .data |>
    dplyr::mutate(greeting = {{ greeting }})
}
Try out greeting functions
library("palmerpenguins")

my_name <- "Ian"
penguins |>  mutate_greet(my_name) # works with vars in environment
penguins |> mutate_greet(species) # works with vars in data# compute on data
penguins |> mutate_greet(paste(species, island)) # getting a little silly
penguins |>
mutate_greet(paste(species, island) |> greet())Curly-curly, revisited
mutate_greet <- function(.data, greeting) {
  .data |>
    dplyr::mutate(greeting = {{ greeting }})
}{{}}:
- freezes the expression, capturing context
- delays evaluation
- function you call must be capable
- tidyverse data-masking and tidy-select functions are capable
Our turn "2.3.7"
Only if needed,
btt22::btt_reset_hard("2.3.7")
Get new files, btt22::btt_get("2.3.7"):
-
plot.R,snapshot.R test-plot.R
usethis::use_package("ggplot2")
Relegation & promotion
Take a seasons (final) data frame for an English team:
# Groups:   country, tier, season [89]
   country tier  season team        date       matches  wins draws losses points goals_for goals_against
   <chr>   <fct>  <int> <chr>       <date>       <int> <int> <int>  <int>  <int>     <int>         <int>
 1 England 2       1920 Leeds Unit… 1921-05-07      42    14    10     18     38        40            45
 2 England 2       1921 Leeds Unit… 1922-05-06      42    16    13     13     45        48            38
 3 England 2       1922 Leeds Unit… 1923-05-05      42    18    11     13     47        43            36
 4 England 2       1923 Leeds Unit… 1924-05-03      42    21    12      9     54        61            35
 5 England 1       1924 Leeds Unit… 1925-05-02      42    11    12     19     34        46            59
 6 England 1       1925 Leeds Unit… 1926-05-01      42    14     8     20     36        64            76
 7 England 1       1926 Leeds Unit… 1927-05-07      42    11     8     23     30        69            88
 8 England 2       1927 Leeds Unit… 1928-05-05      42    25     7     10     57        98            49
What happens over time as we get promoted and relegated?
This sounds like a job for {ggplot2}!
Try out new code
go through code, tests
document(),test(),check(),install()
leeds_united <-
  uss_get_matches("england") |>
  uss_make_teams_matches() |>
  dplyr::filter(team == "Leeds United") |>
  uss_make_seasons_final()
# A tibble: 89 × 12
# Groups: country, tier, season [89]
country tier season team date matches wins draws losses points goals_for goals_against
<chr> <fct> <int> <chr> <date> <int> <int> <int> <int> <int> <int> <int>
1 England 1 1924 Leeds Unit… 1925-05-02 42 11 12 19 34 46 59
2 England 1 1925 Leeds Unit… 1926-05-01 42 14 8 20 36 64 76
3 England 1 1926 Leeds Unit… 1927-05-07 42 11 8 23 30 69 88Try out new code (cont.)
# uss_plot_seasons_tiers(leeds_united) throwing erroruss_plot_seasons_tiers()
We want to specify what to plot on the y-axis. So let’s add an argument aes_y to the function:
- make default value
.data$wins - document:
#' @param aes_y - in function, modify
aes(y = .data$wins)using{{}} - uncomment test,
devtools::test() - add to package vignette
devtools::check()
Our turn
In uss_plot_seasons_tiers():
ggplot2::geom_point(
  ggplot2::aes(
    x = .data$season,
    y = {{ aes_y }},
  ),
  color = "#333333" # use something like #111111
) testthat::snapshot_review('plot/')accept changes (or not), change back (or not)
Summary
There are a lot of tidy-eval tools:
- know if you are using a data-masking or tidy-select function.
-
data-masking function using tidy-select syntax:
across()
- to move a bunch of arguments, pass the dots,
...
- to splice a list (or vector) into dynamic-dots, use
!!!
- to interpolate a single argument, use
{{}}
Summary: disambiguation
For data-masking functions, use .data, .env pronouns:
Additional material
Jenny Bryan motivates tidy eval at rstudio::conf(2019):
-
01:30- scoped verbs, e.g.mutate_at(), now:across() -
16:18-enquo()and!!, now:{{}}
Additional material
Lionel Henry talks about data-masking and tidy-select at rstudio::conf(2020).
Additional material
Hadley gives a five-minute tour of the next layer of the tidy-eval onion.