library(tidyverse)

library(tidyverse)

bikes <- readr::read_csv(
  here::here("data", "london-bikes-custom.csv"),
  col_types = "Dcfffilllddddc"
)

bikes$season <- forcats::fct_inorder(bikes$season)

theme_set(theme_light(base_size = 14, base_family = "Roboto Condensed"))

theme_update(
  panel.grid.minor = element_blank(),
  plot.title = element_text(face = "bold"),
  legend.position = "top",
  plot.title.position = "plot"
)Graphic Design with ggplot2
Working with Colors
Pre-Defined Color Palettes: Viridis
Pre-Defined Color Palettes: Viridis

Pre-Defined Color Palettes: Viridis

Pre-Defined Color Palettes: Viridis
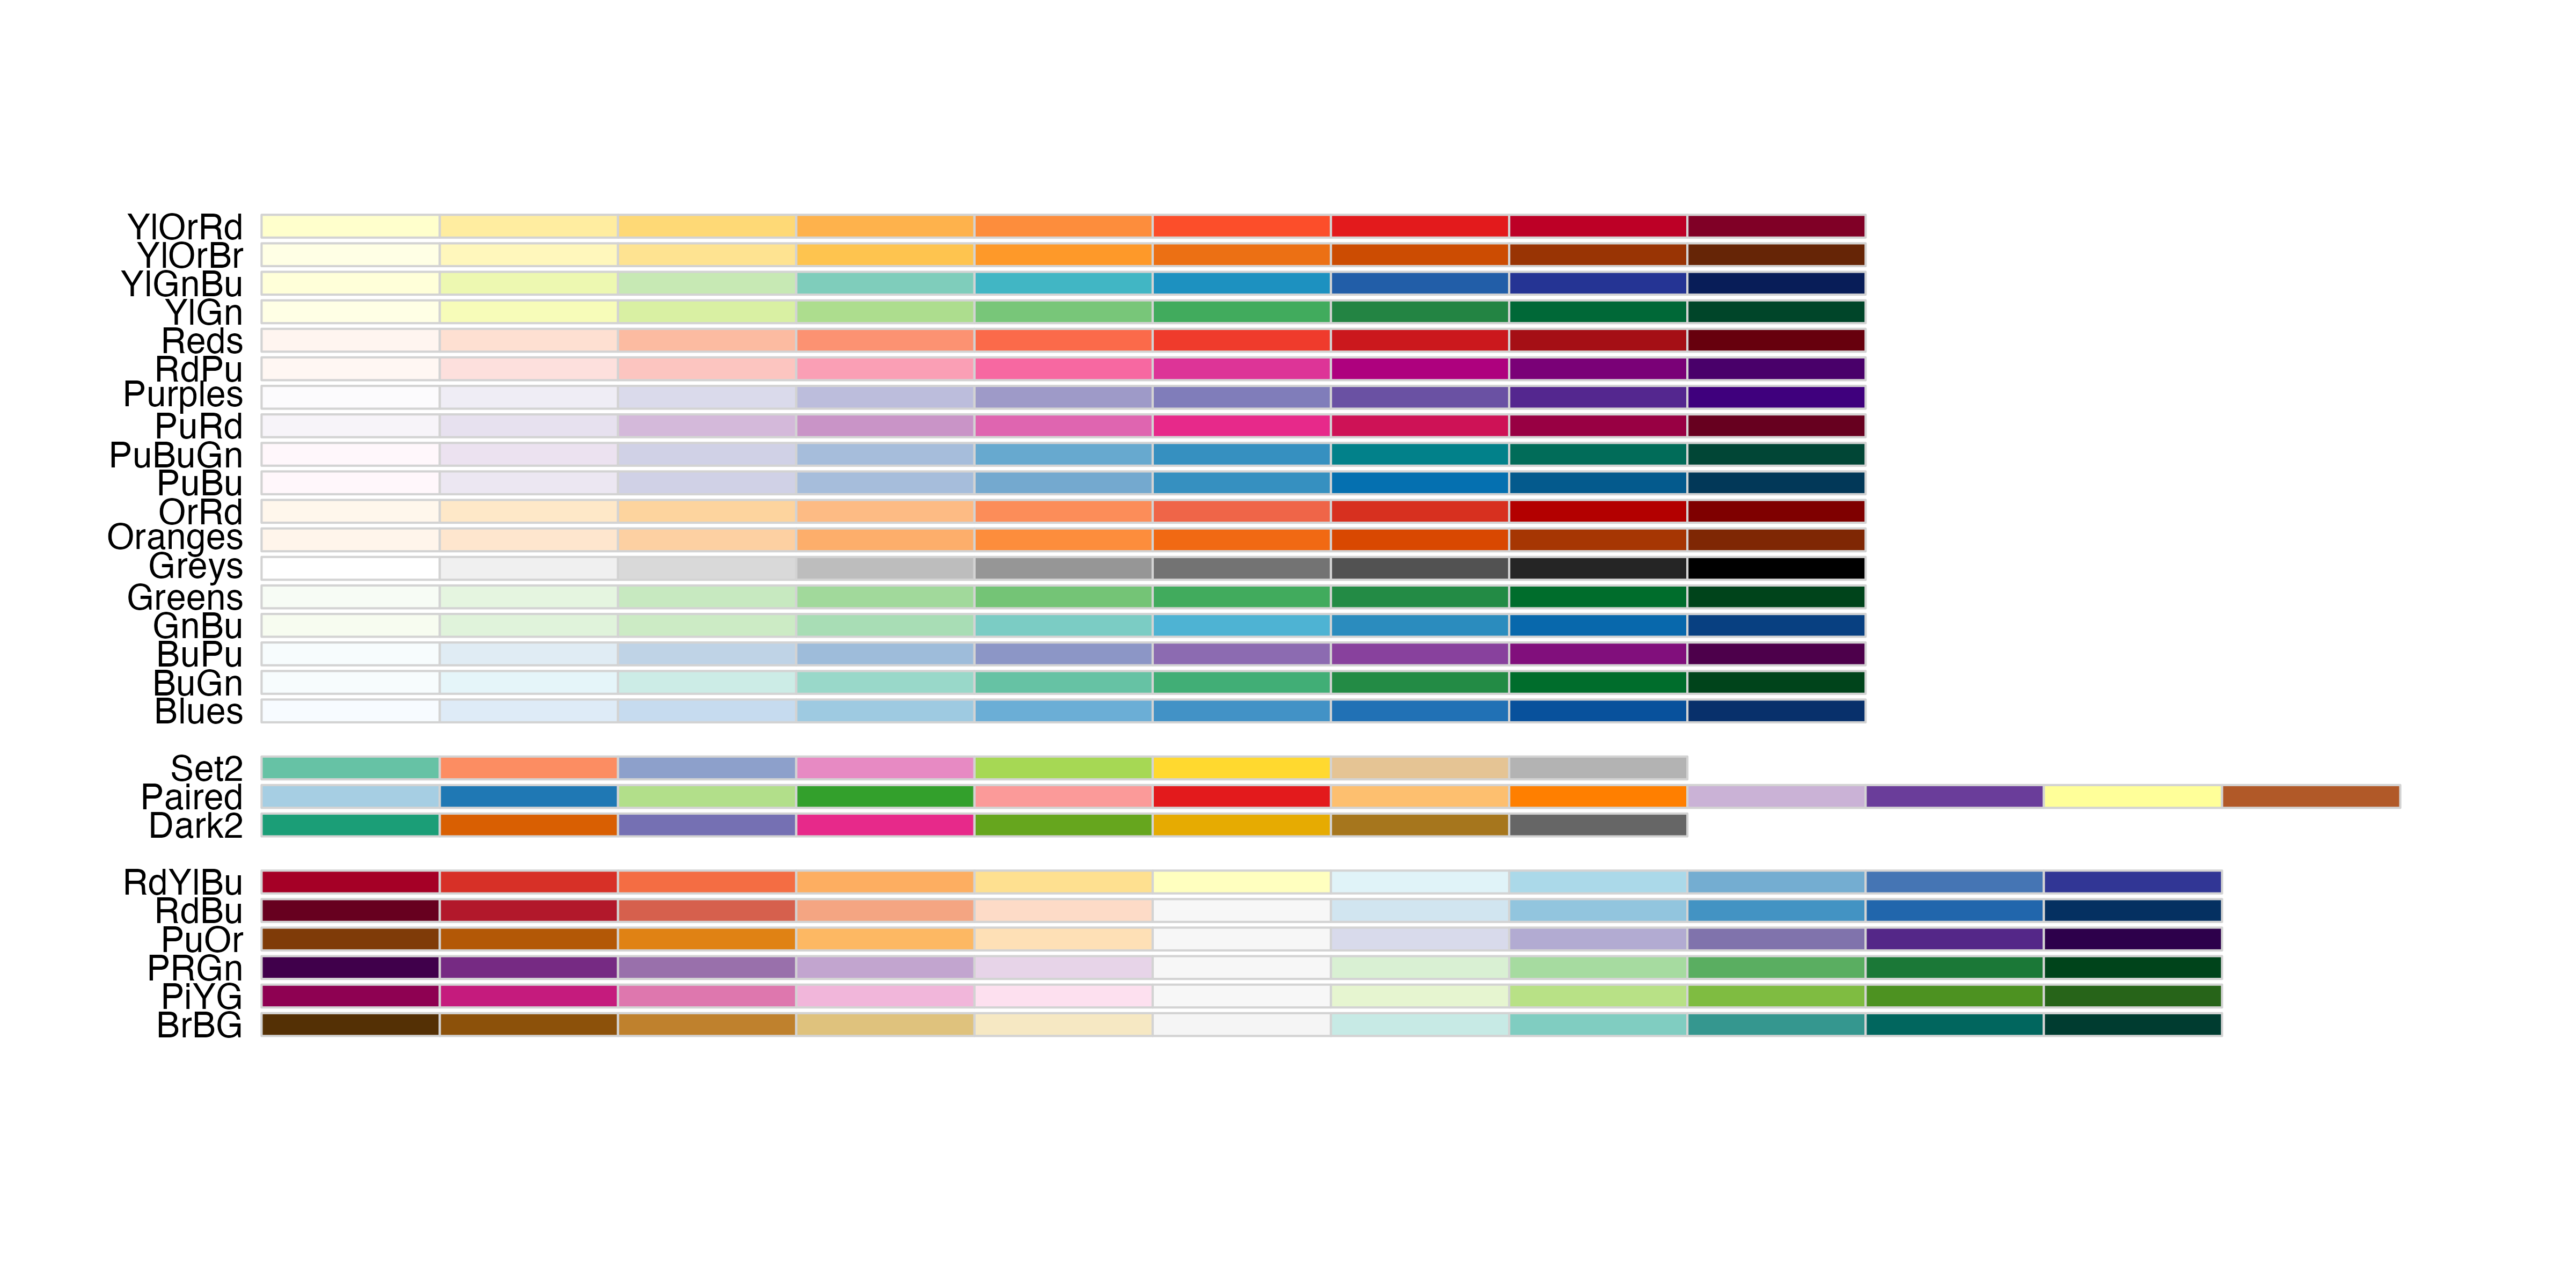
Pre-Defined Color Palettes: Brewer

Pre-Defined Color Palettes: Brewer

Pre-Defined Color Palettes: Brewer
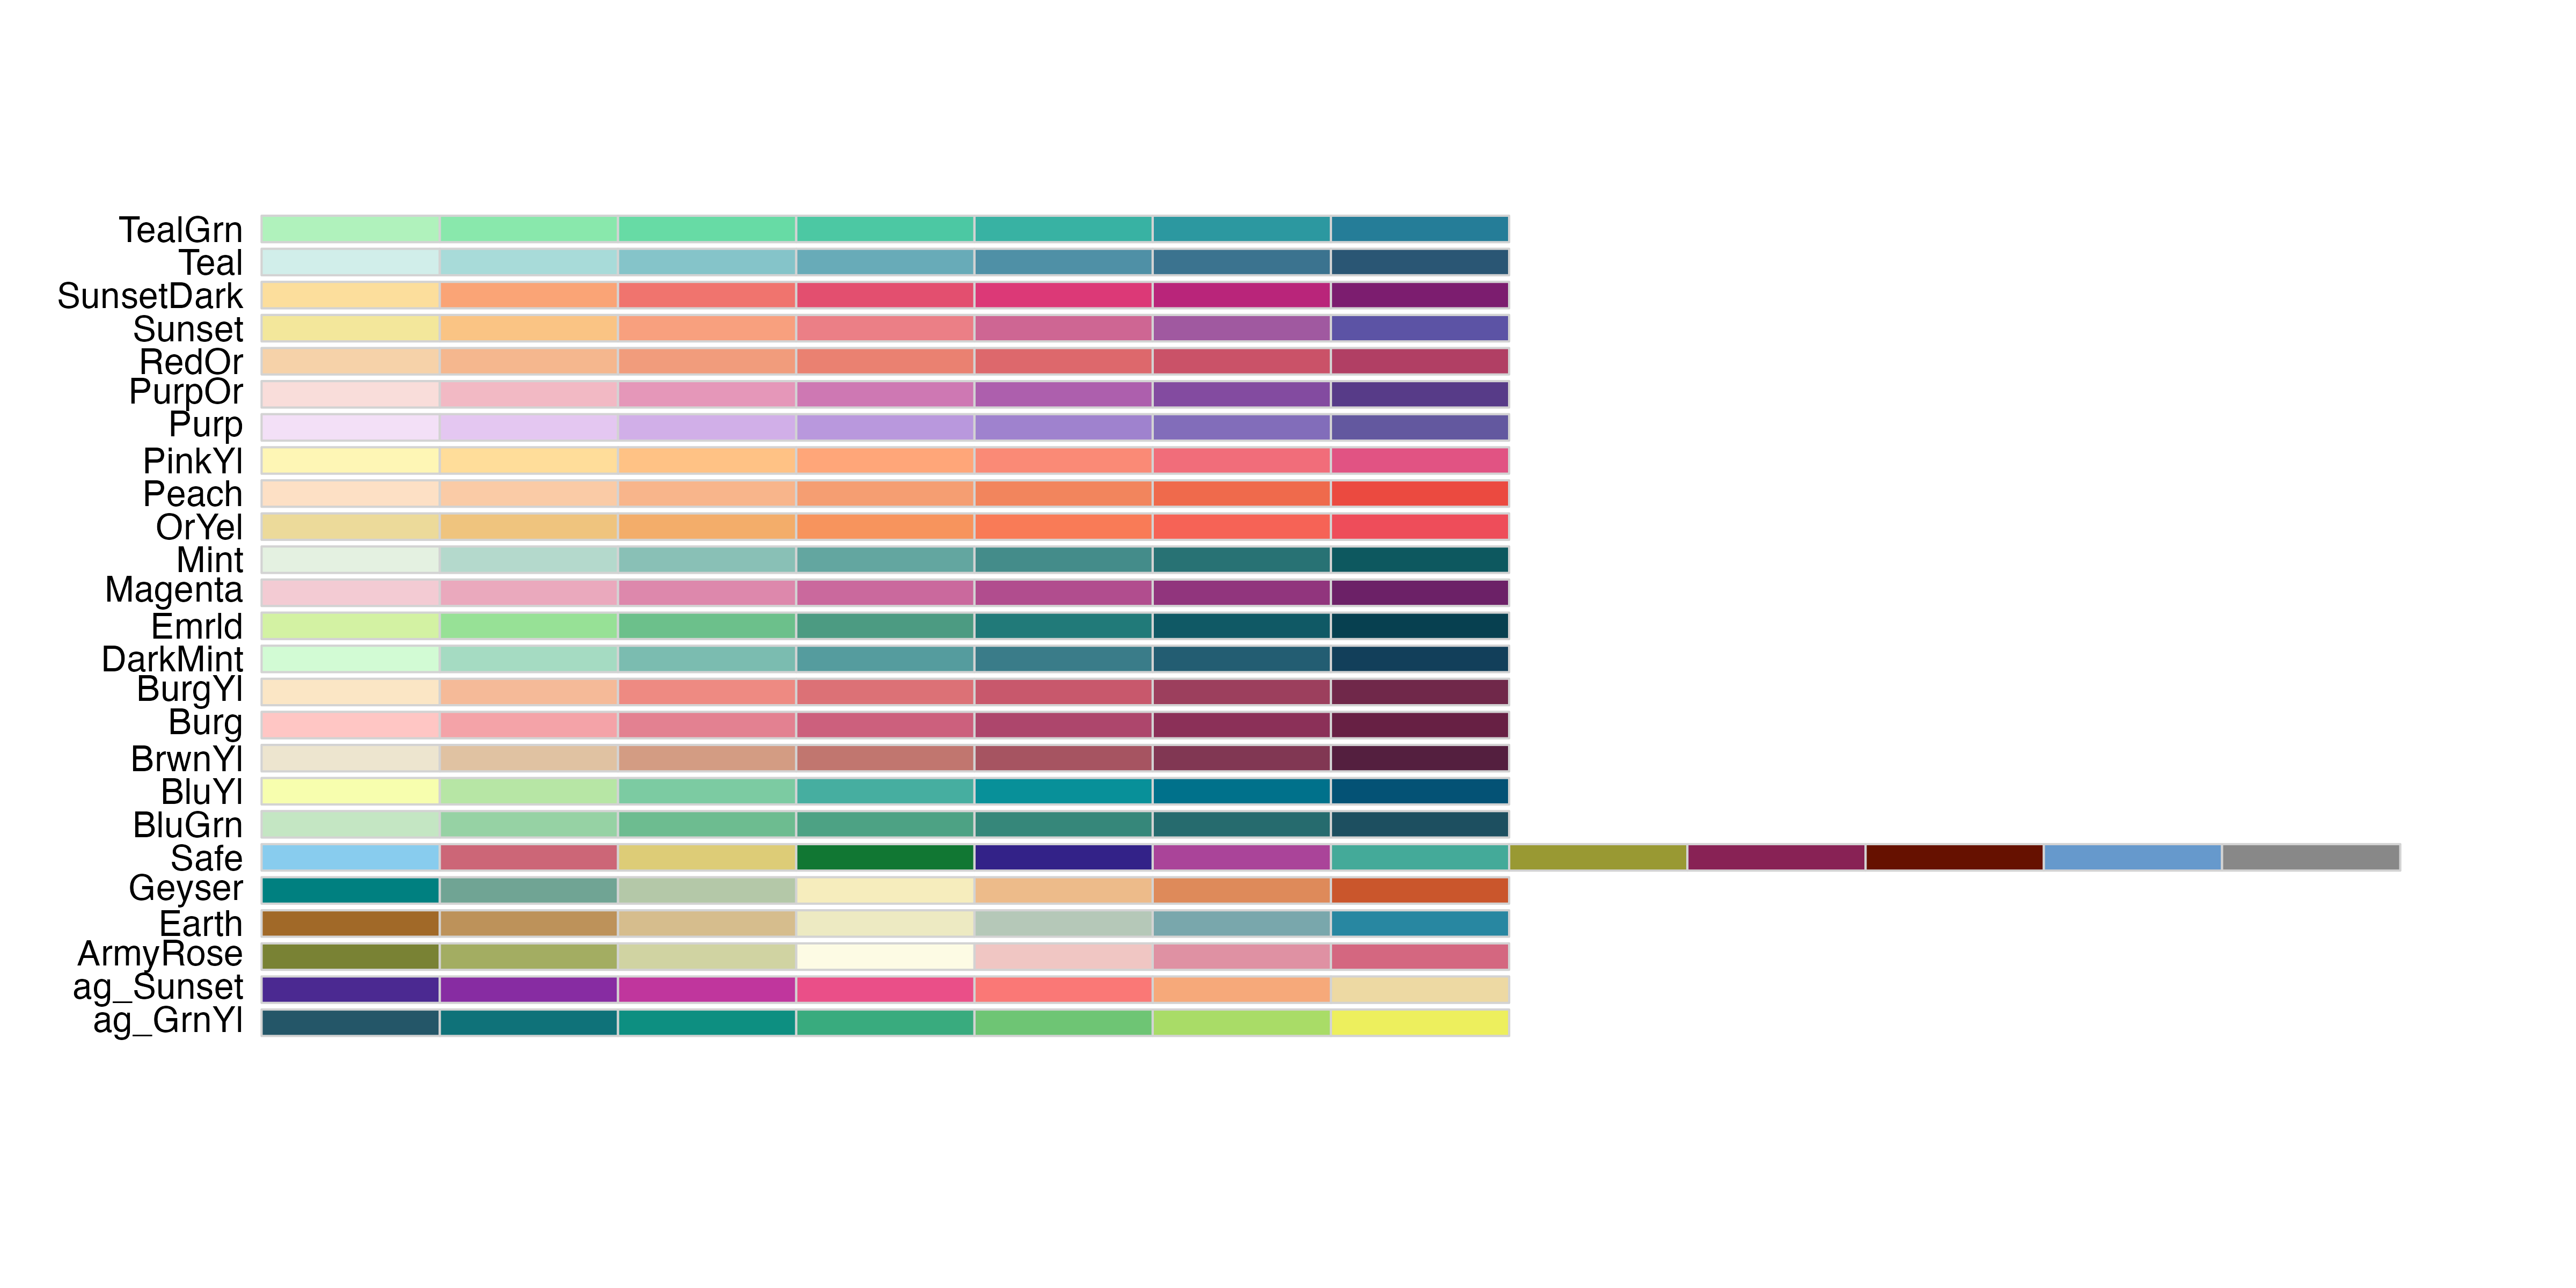
{rcartocolor}
{rcartocolor}
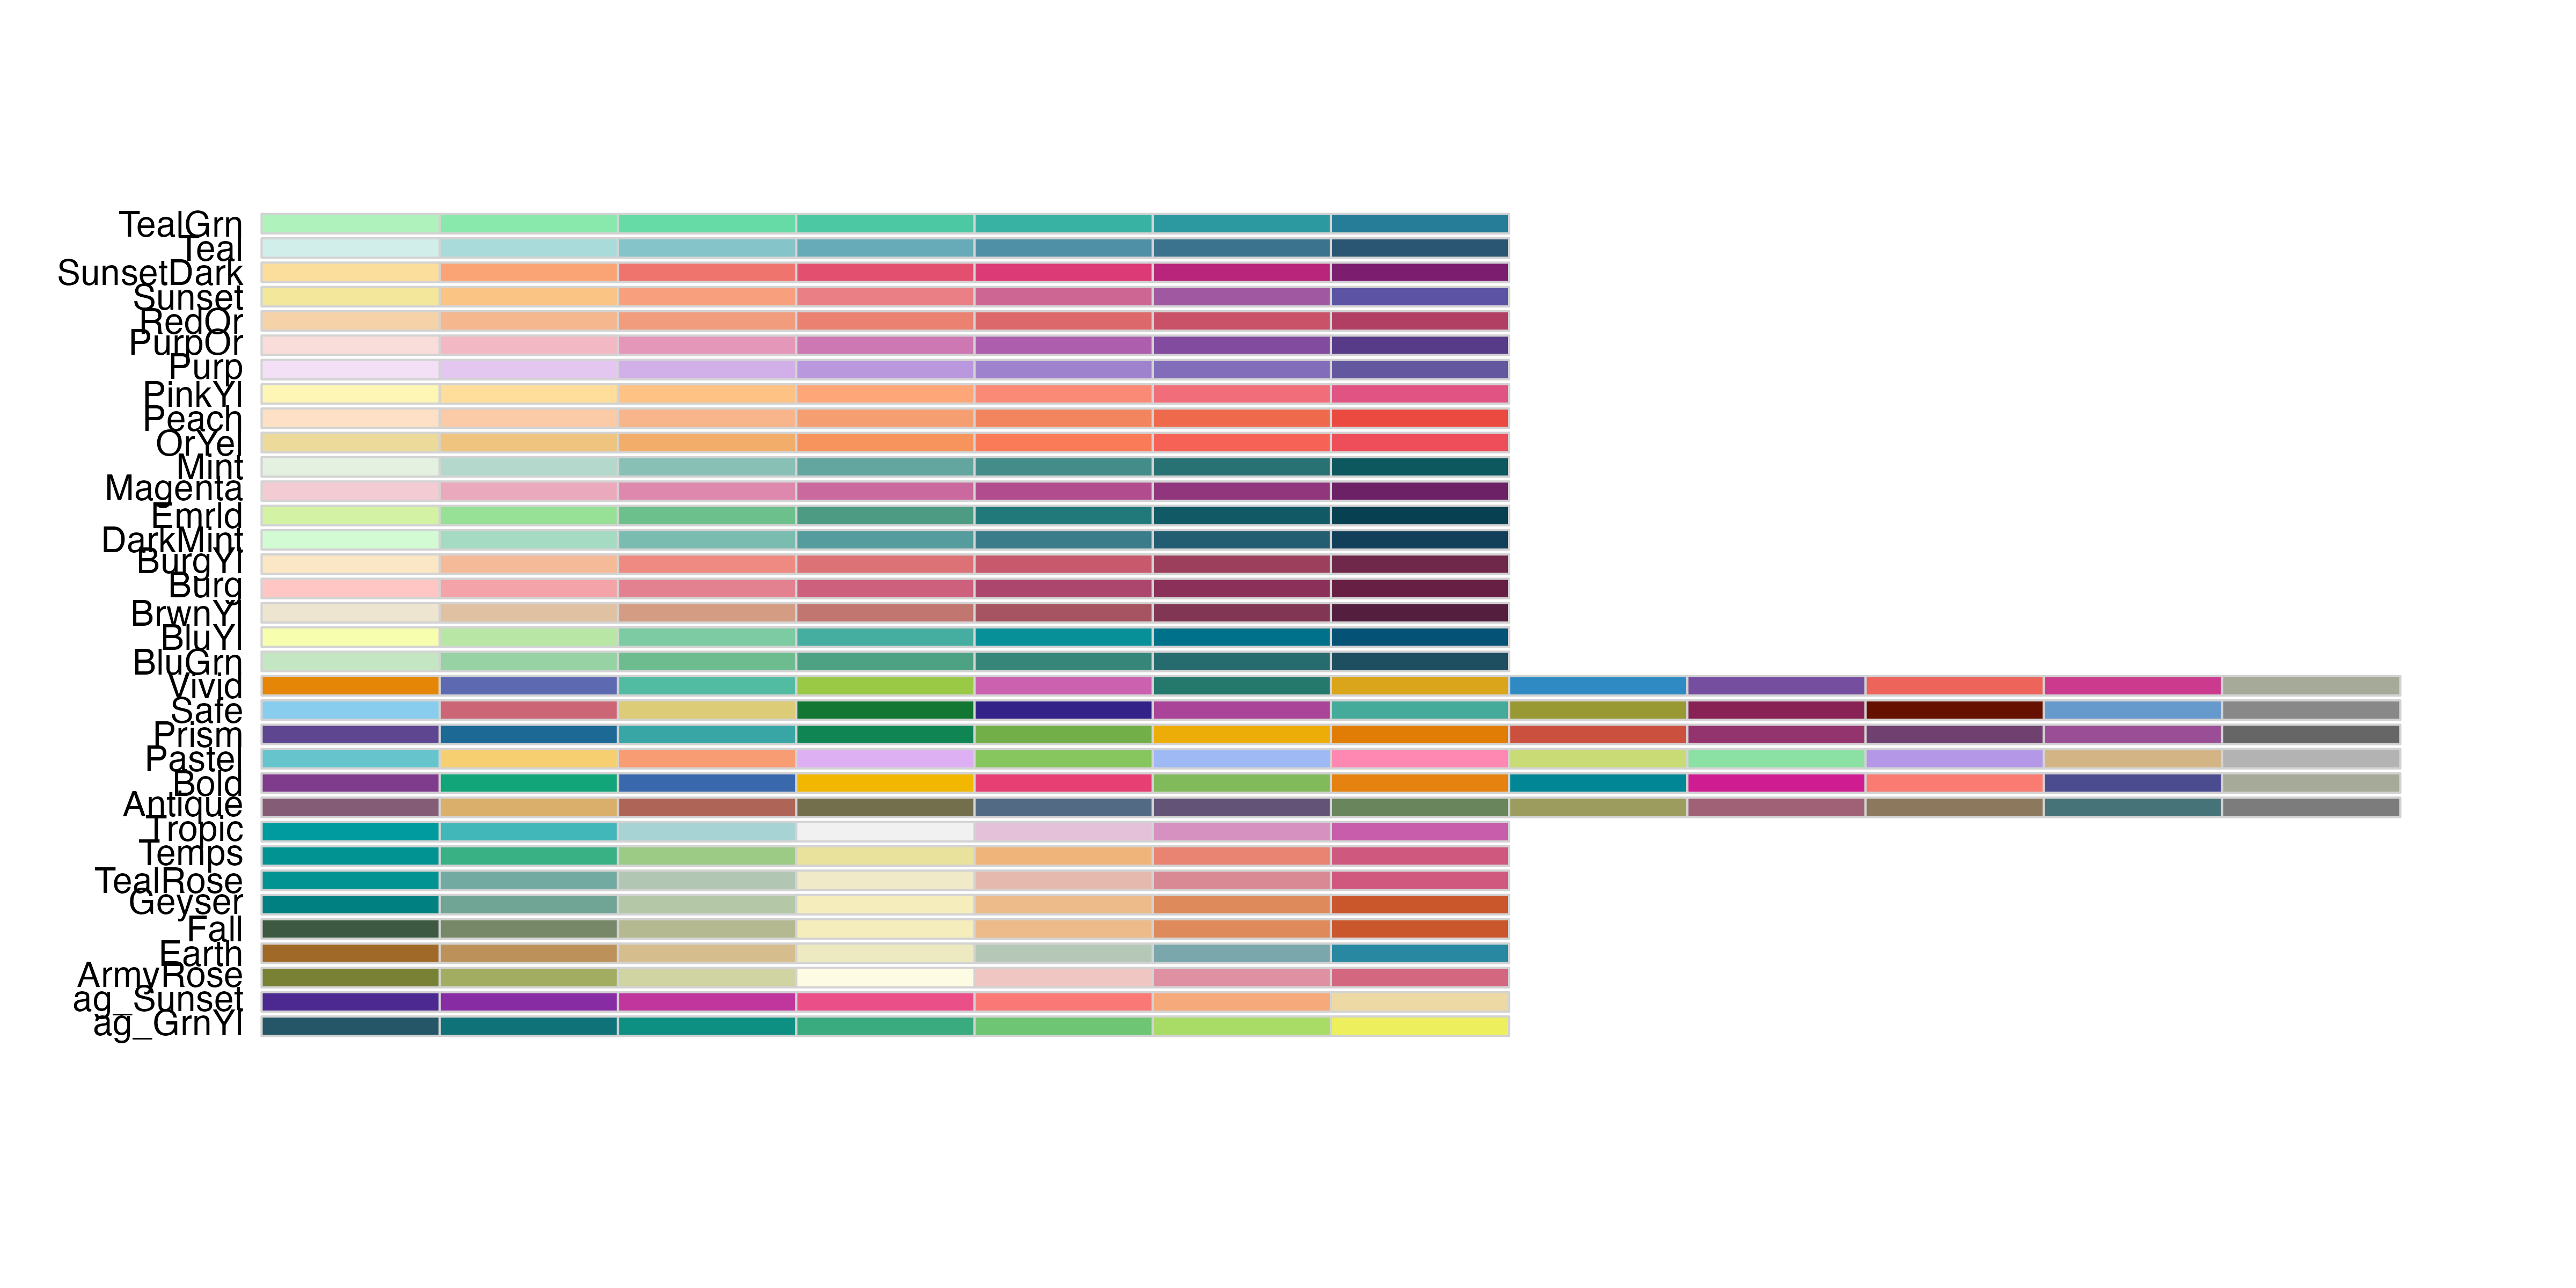
{rcartocolor}
{scico}
{scico}
{ggsci} and {ggthemes}

{nord}
{nord}
{MetBrewer}
{MetBrewer}
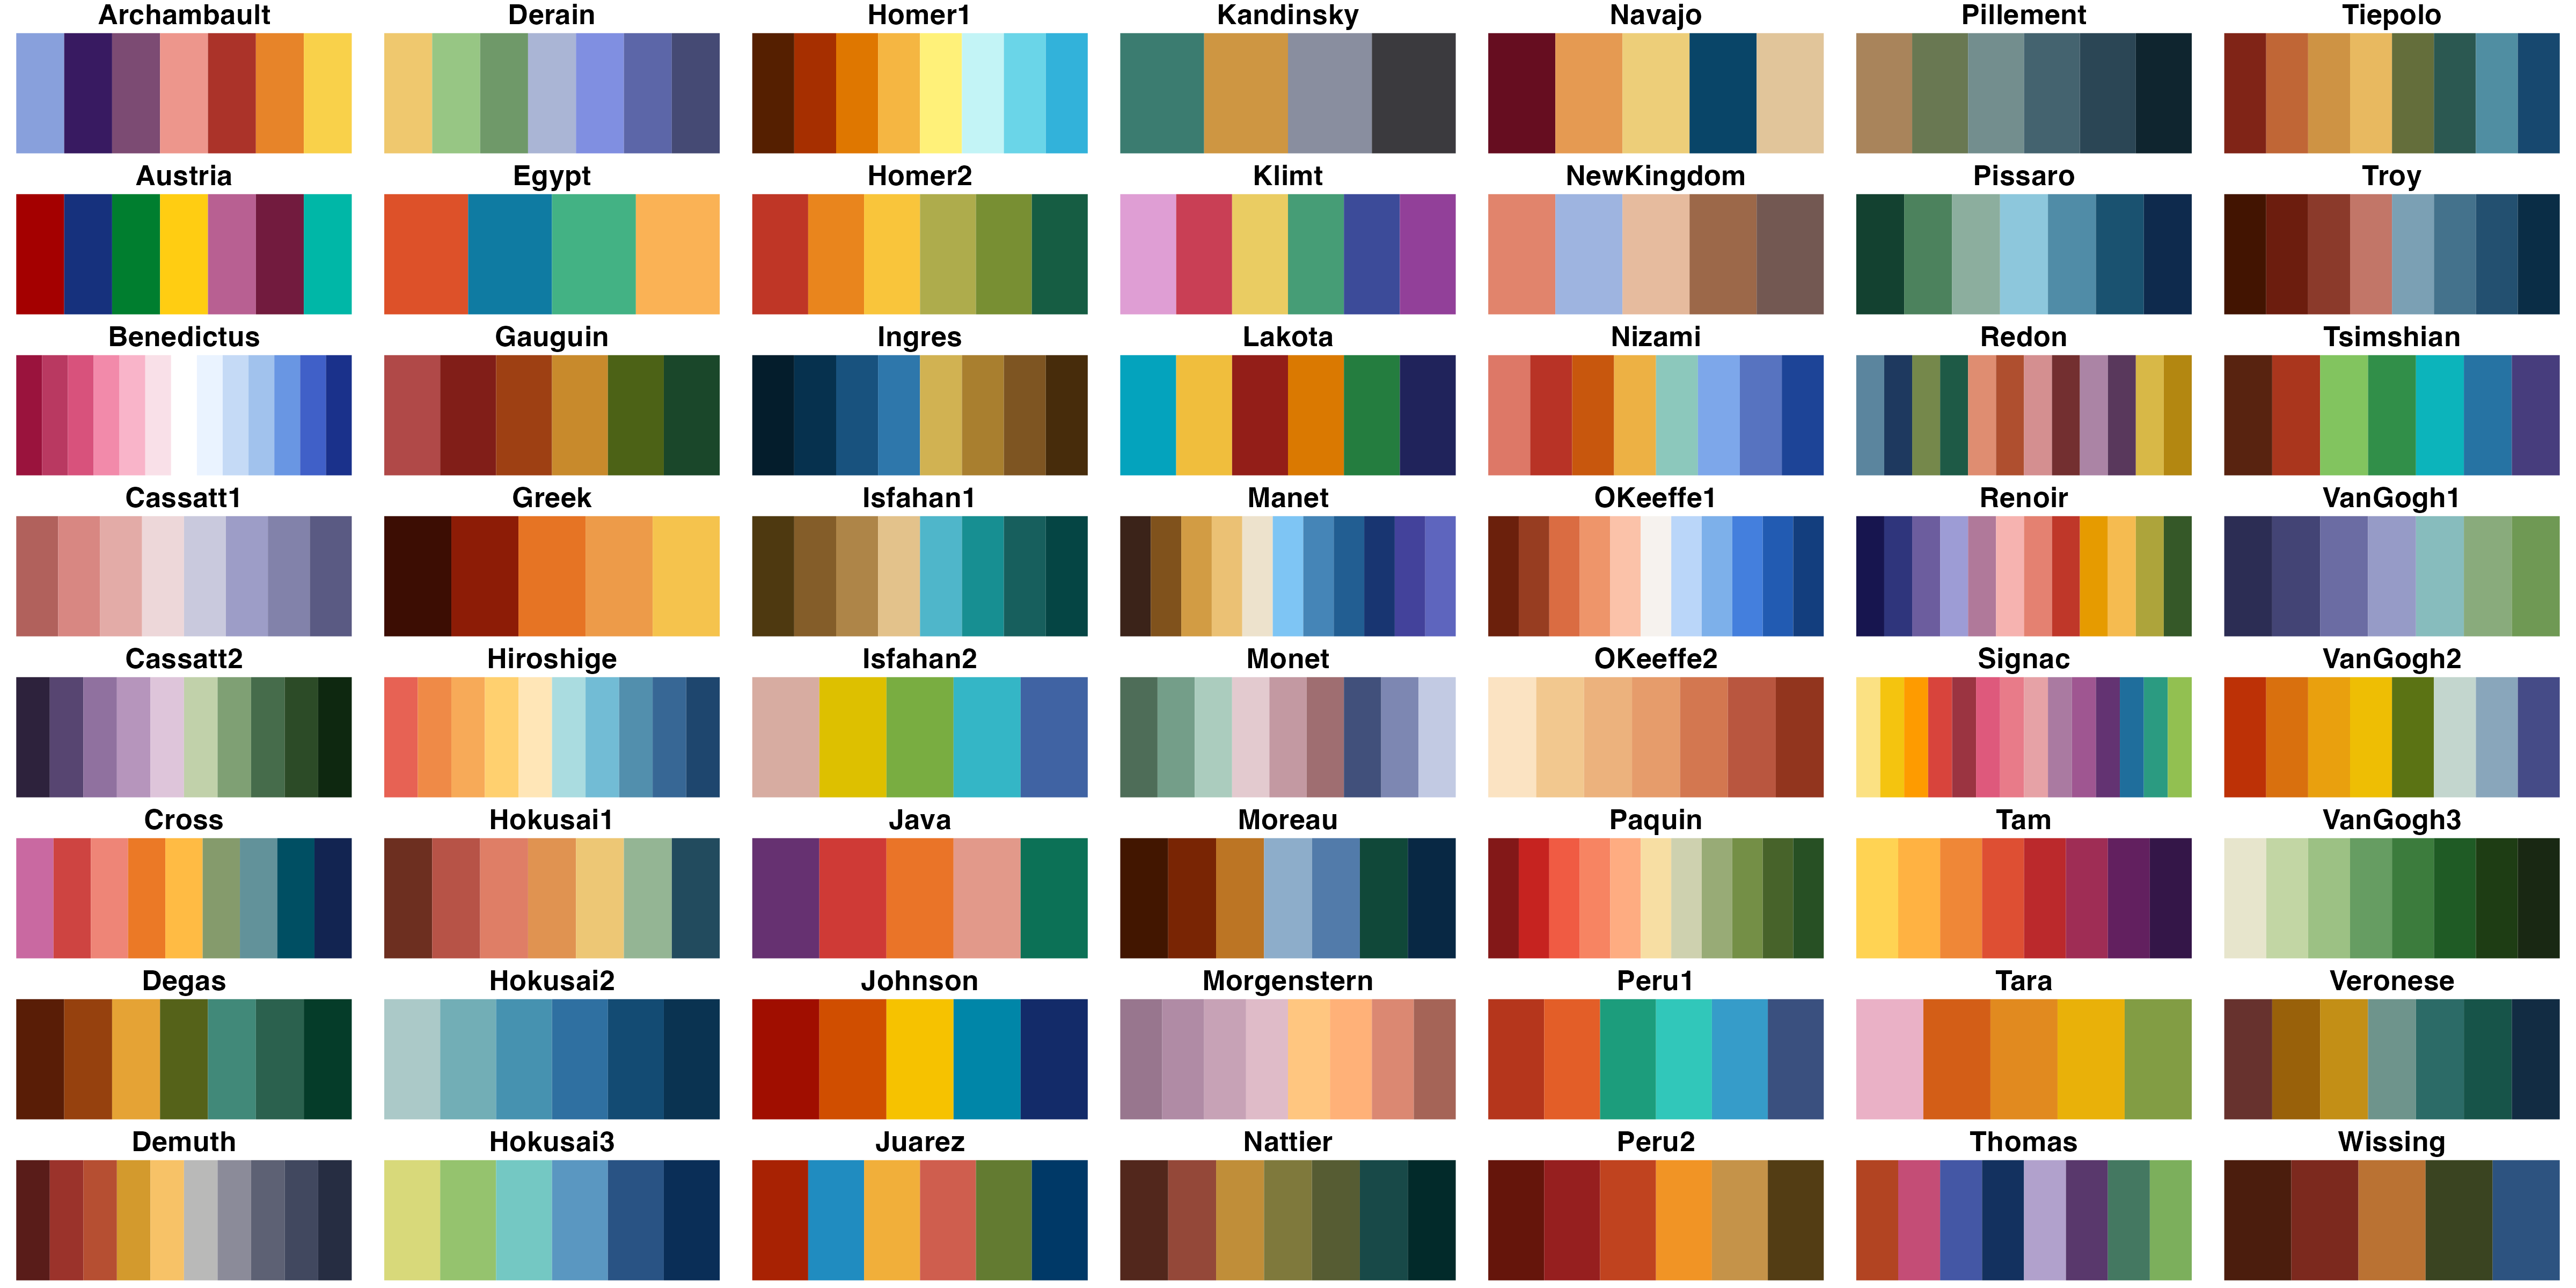
{MetBrewer}
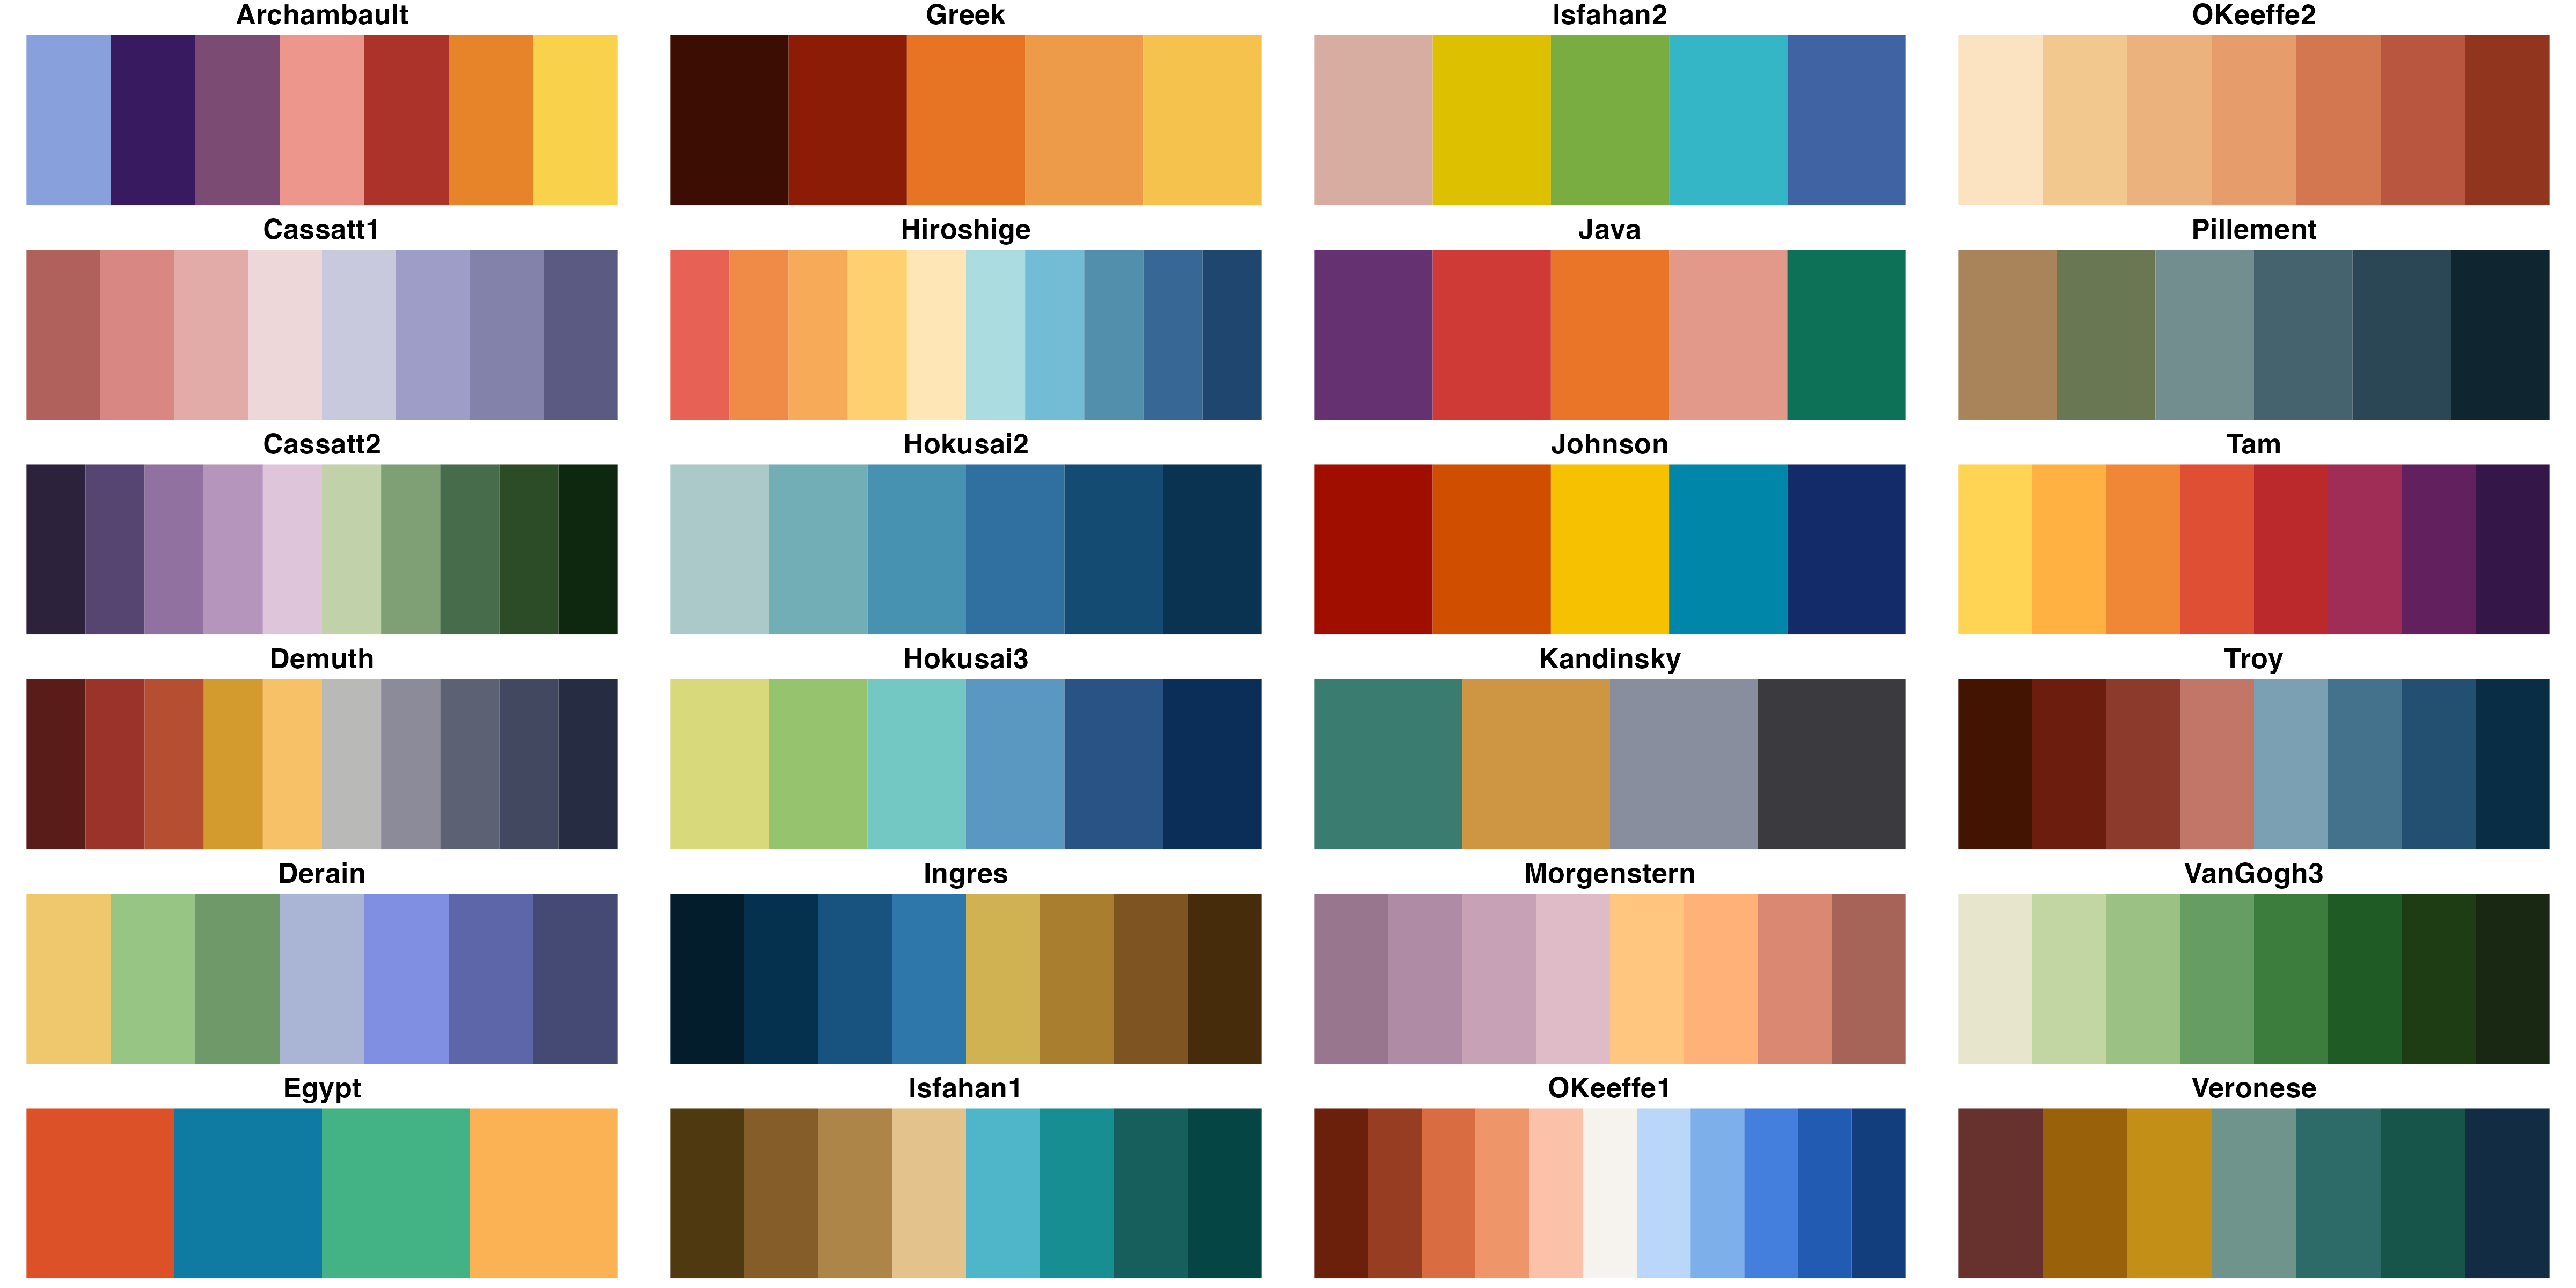
{MetBrewer}

Customize Existing Palettes

Customize Existing Palettes
Customize Existing Palettes
Customize Existing Palettes

Customize Existing Palettes
Customize Existing Palettes

Customize Existing Palettes

Customize Existing Palettes
Customize Existing Palettes

Customize Existing Palettes

Customize Existing Palettes
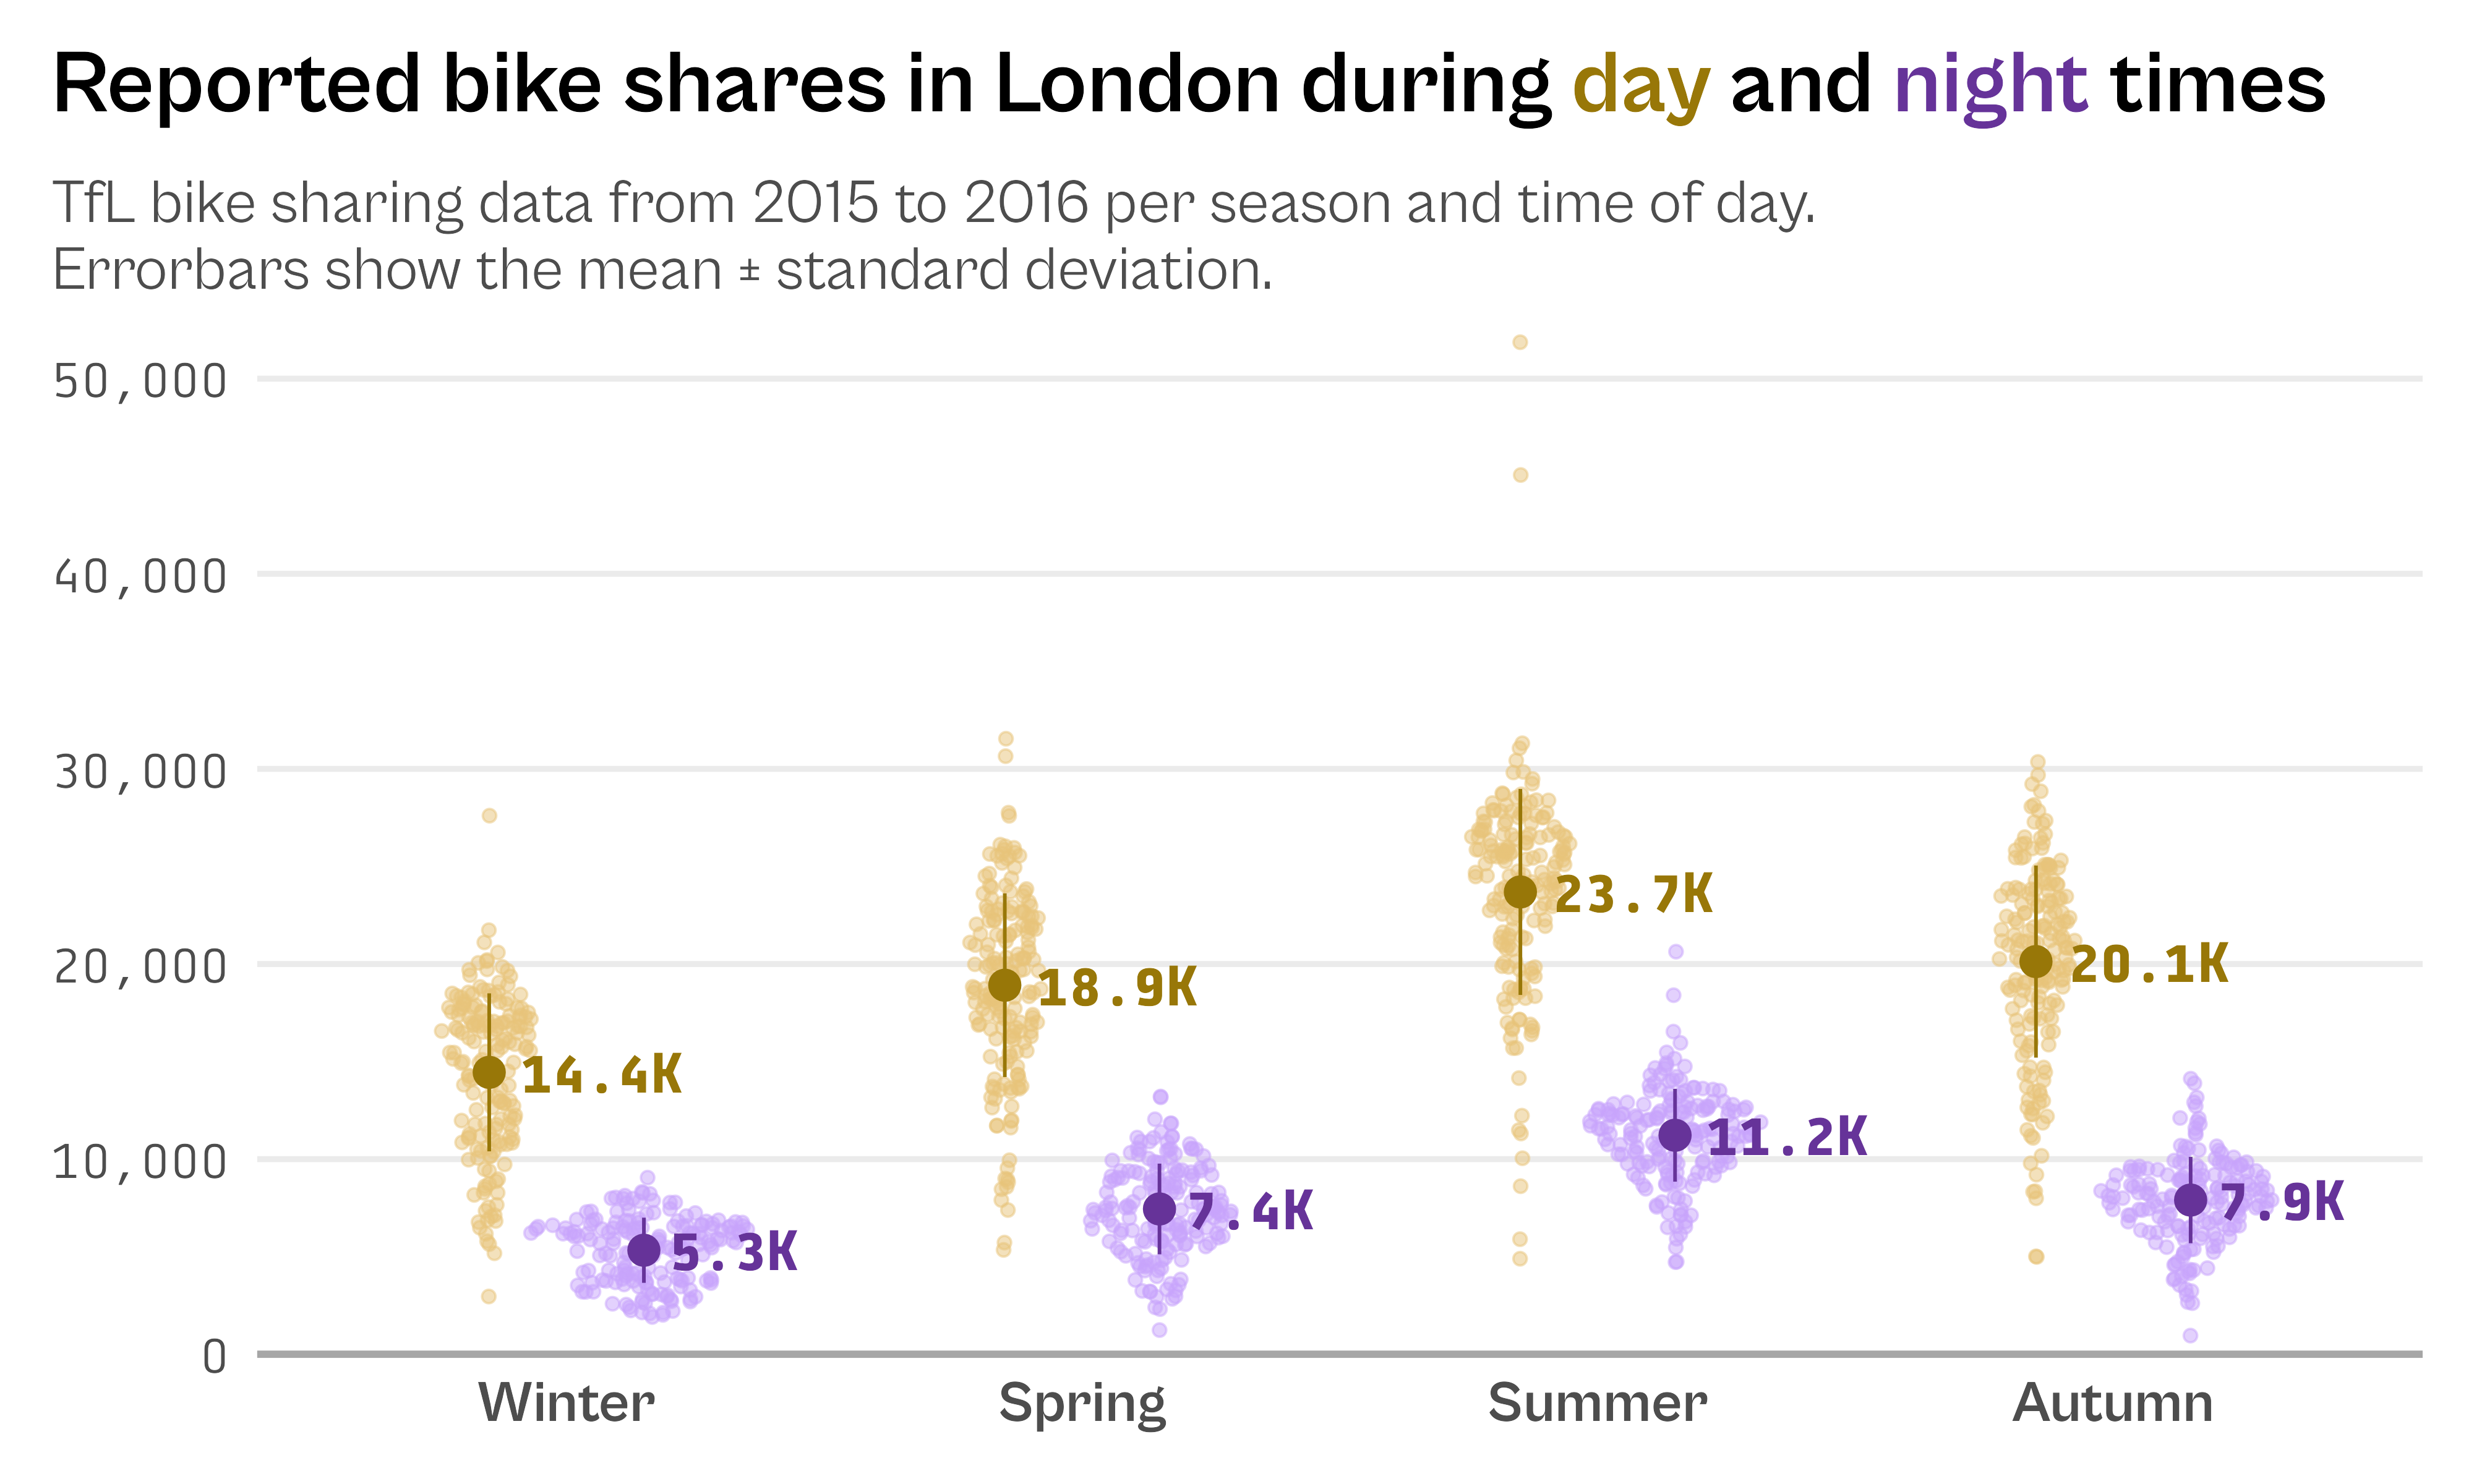
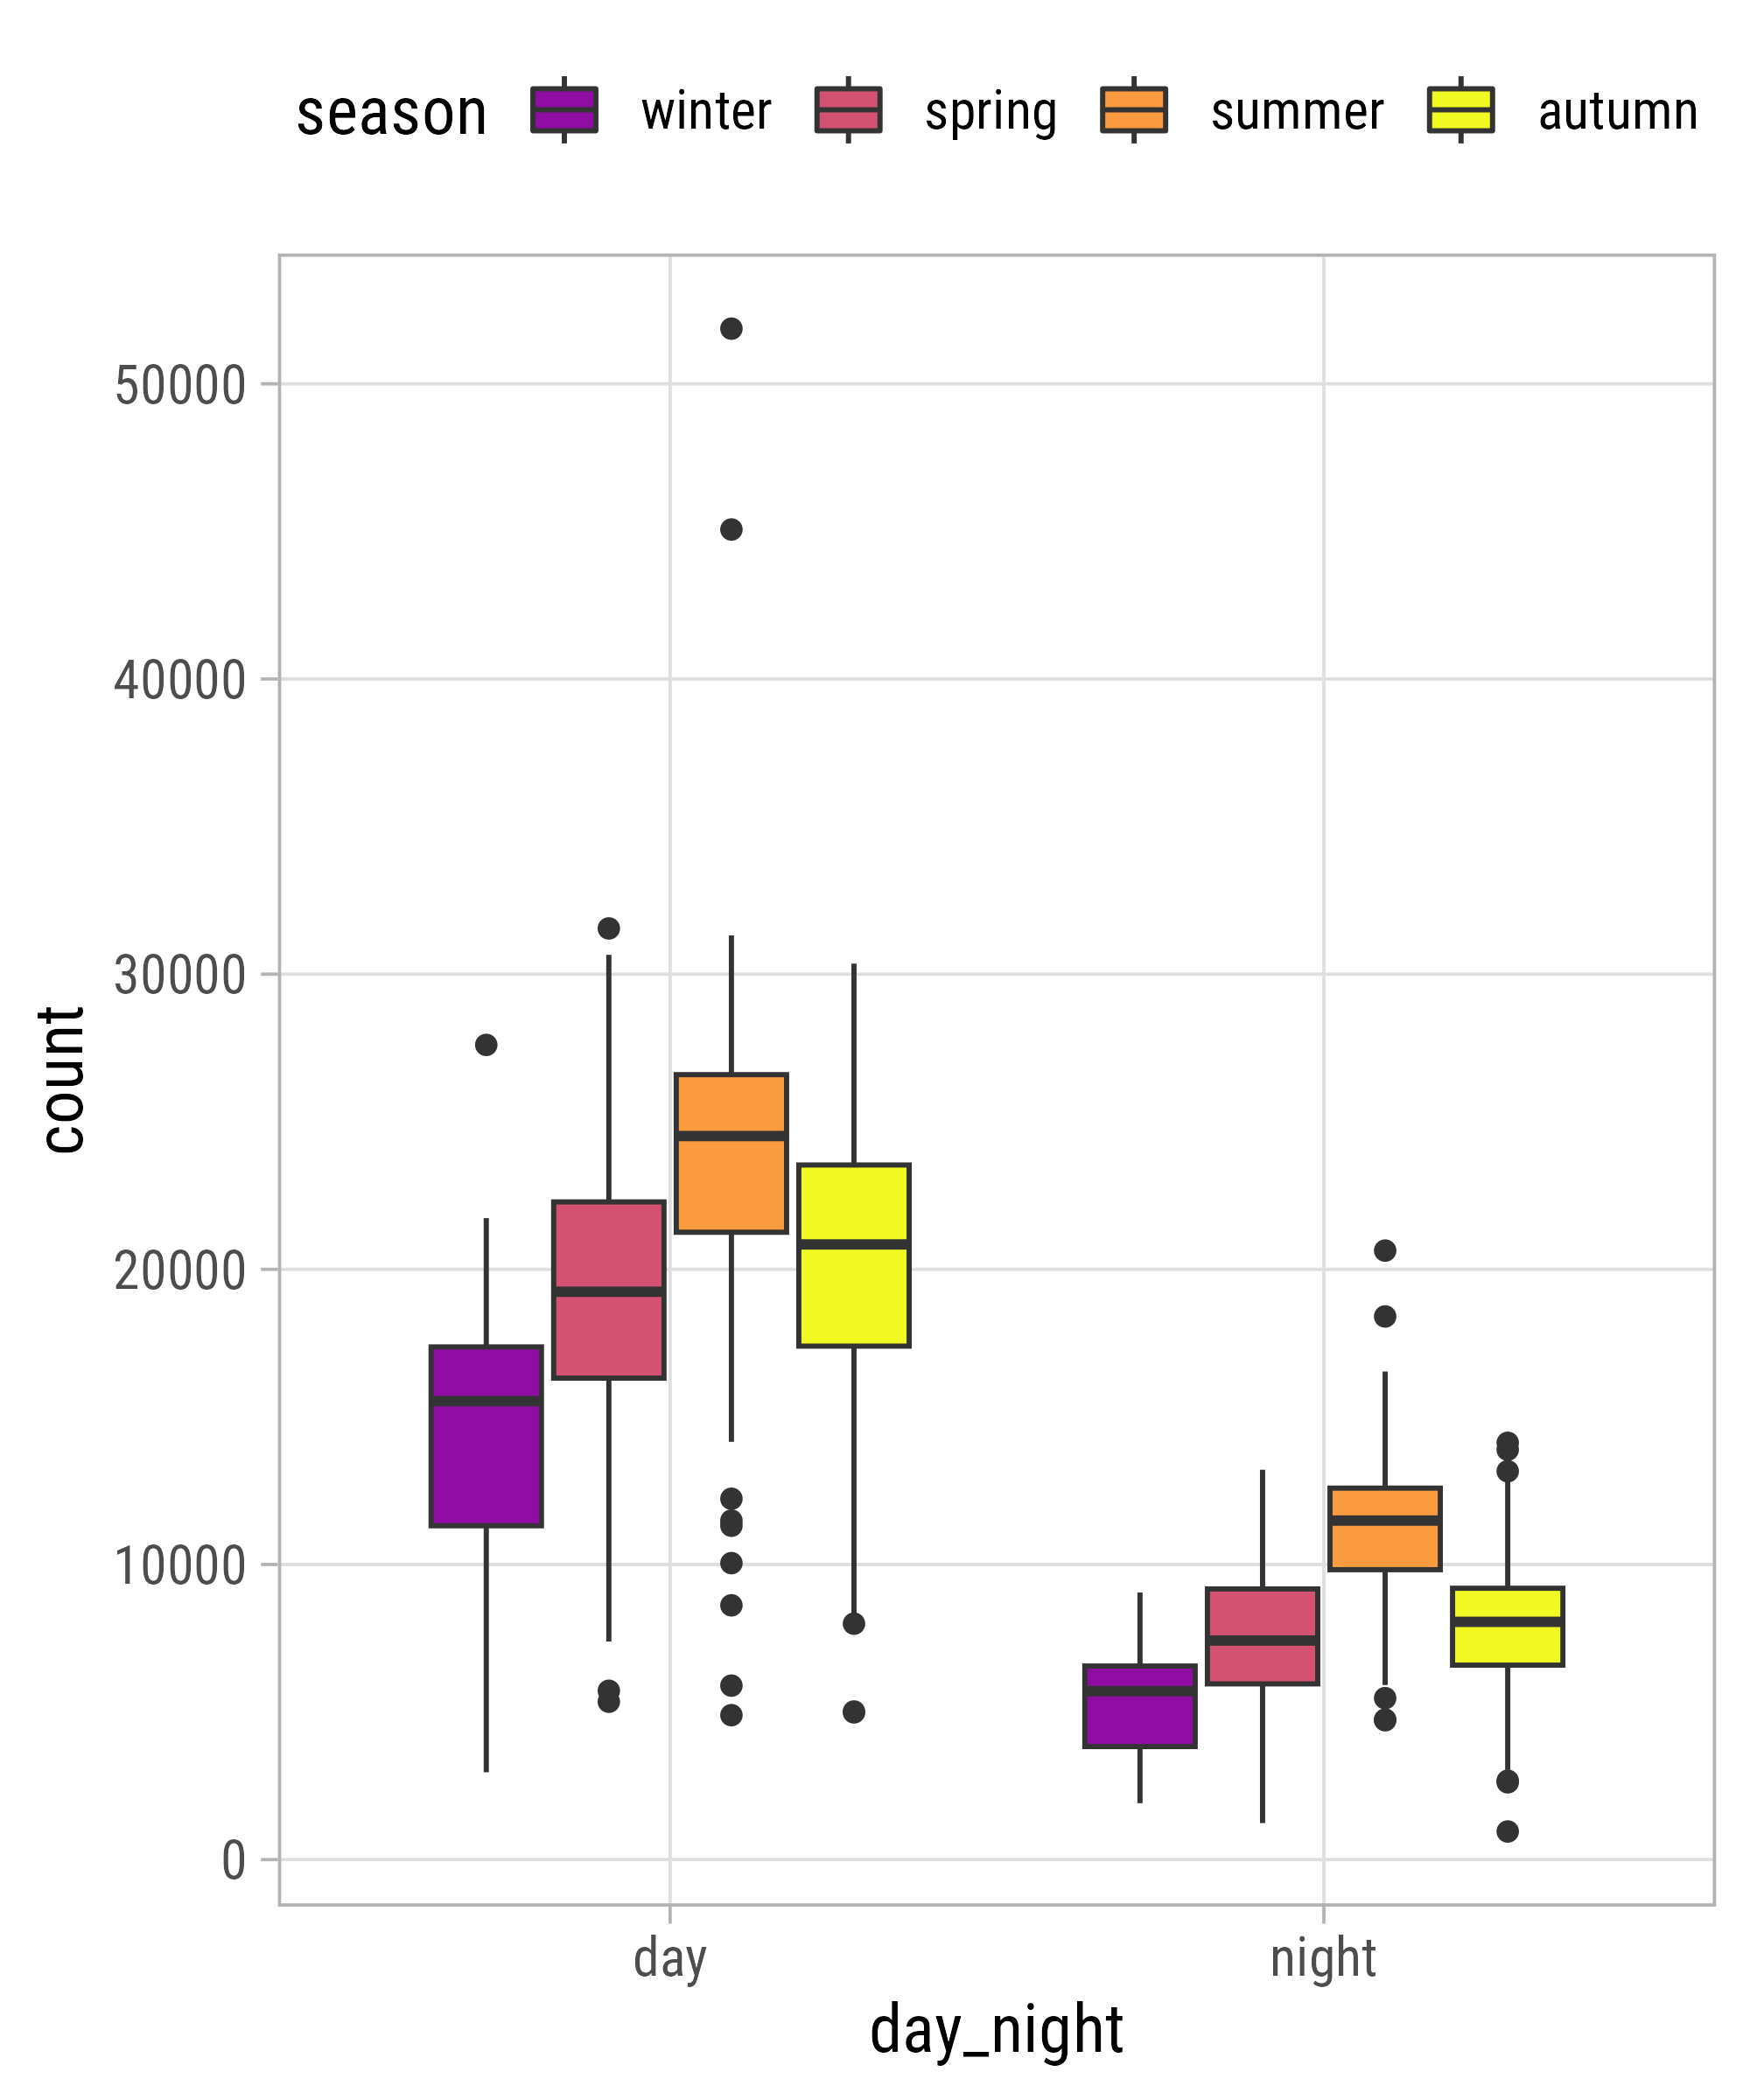
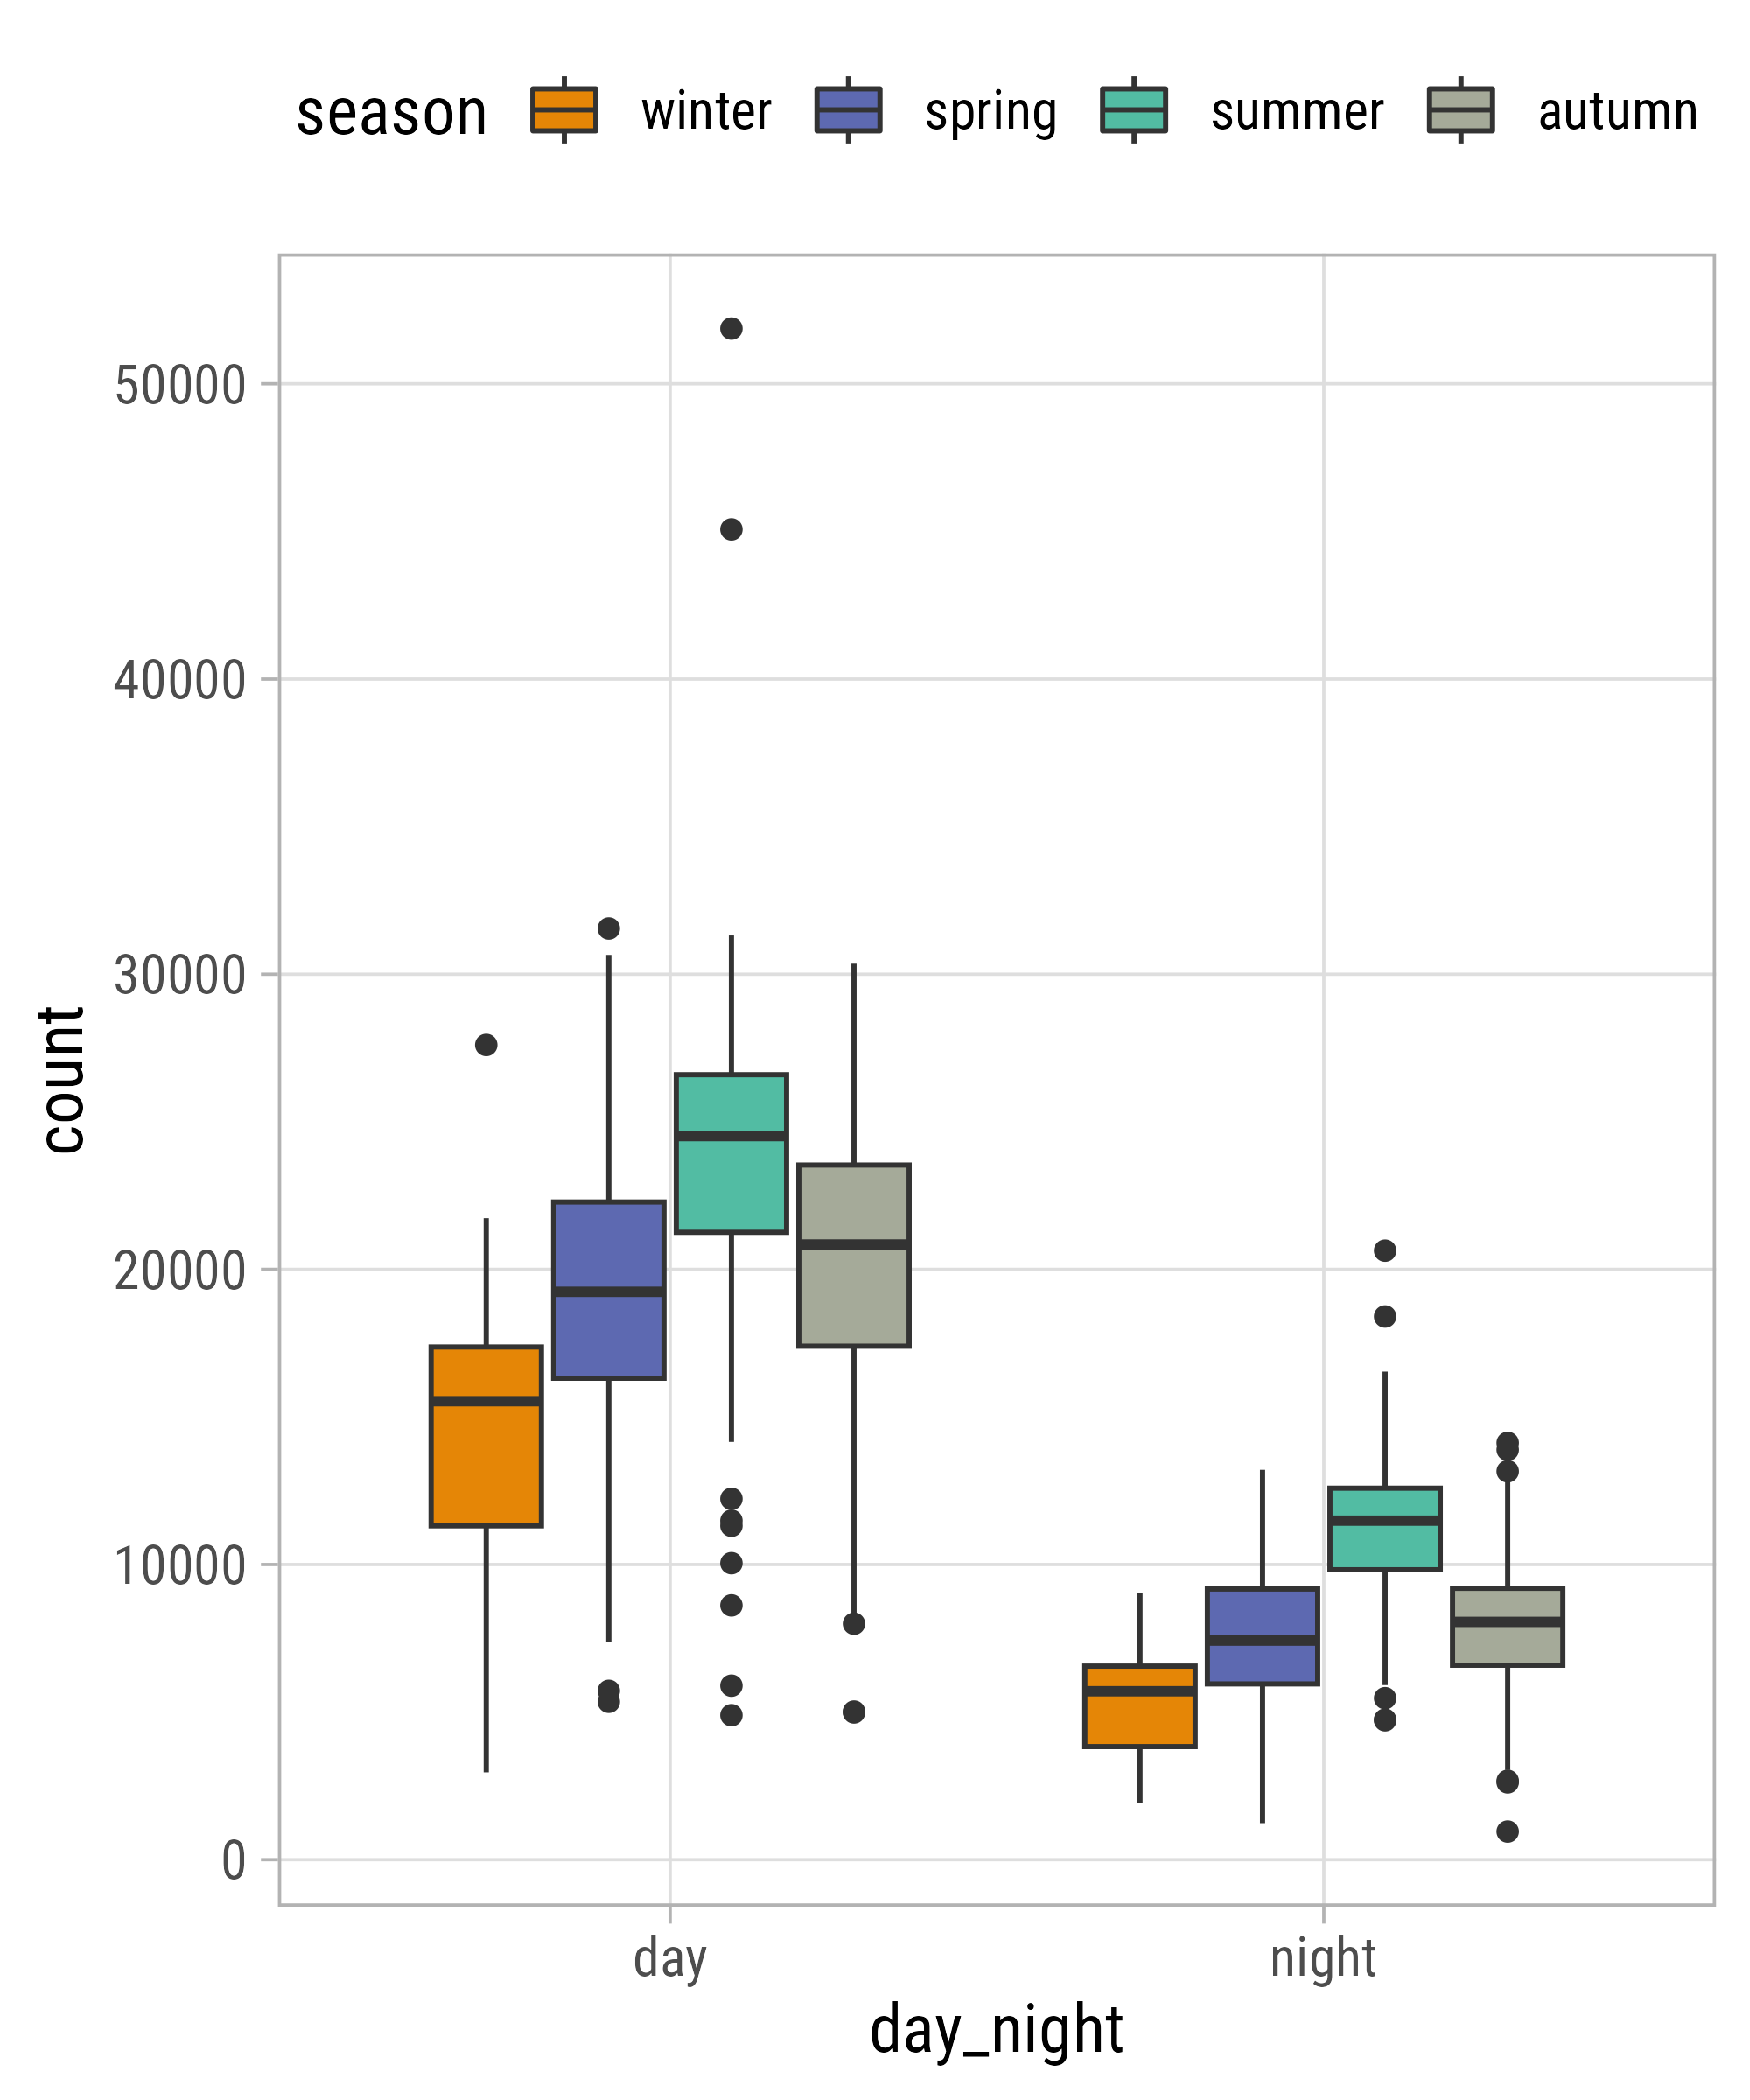
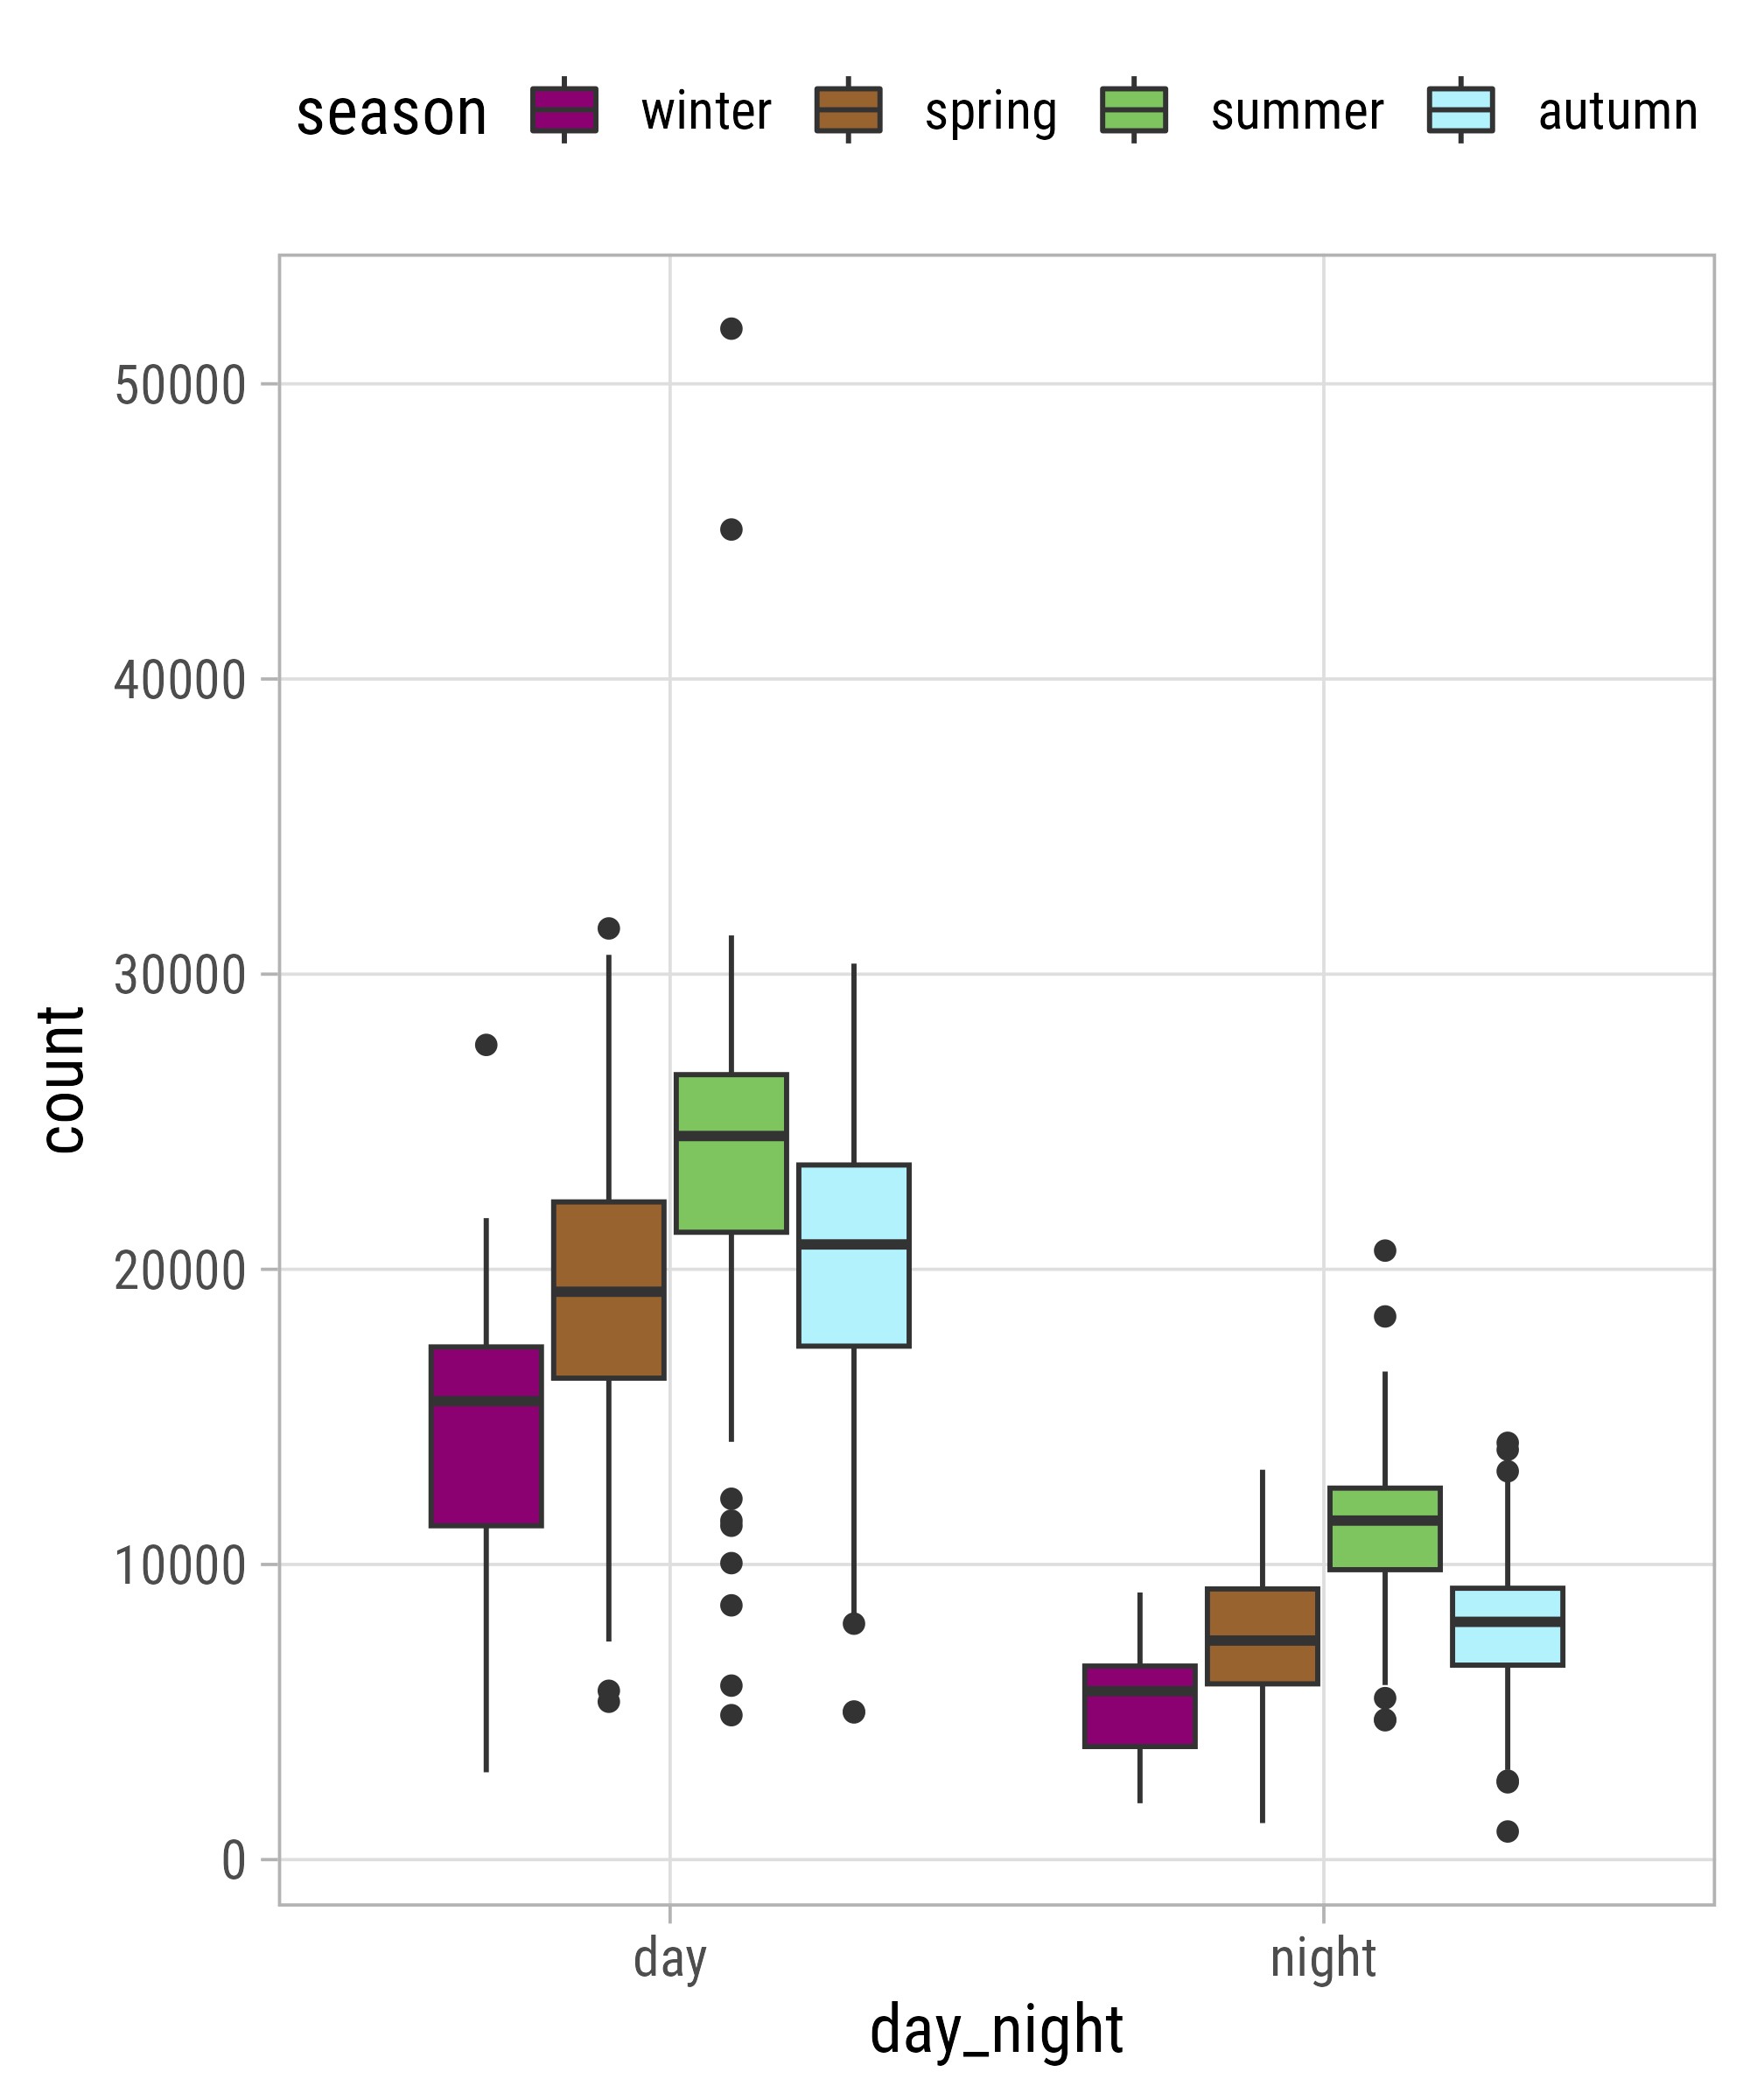
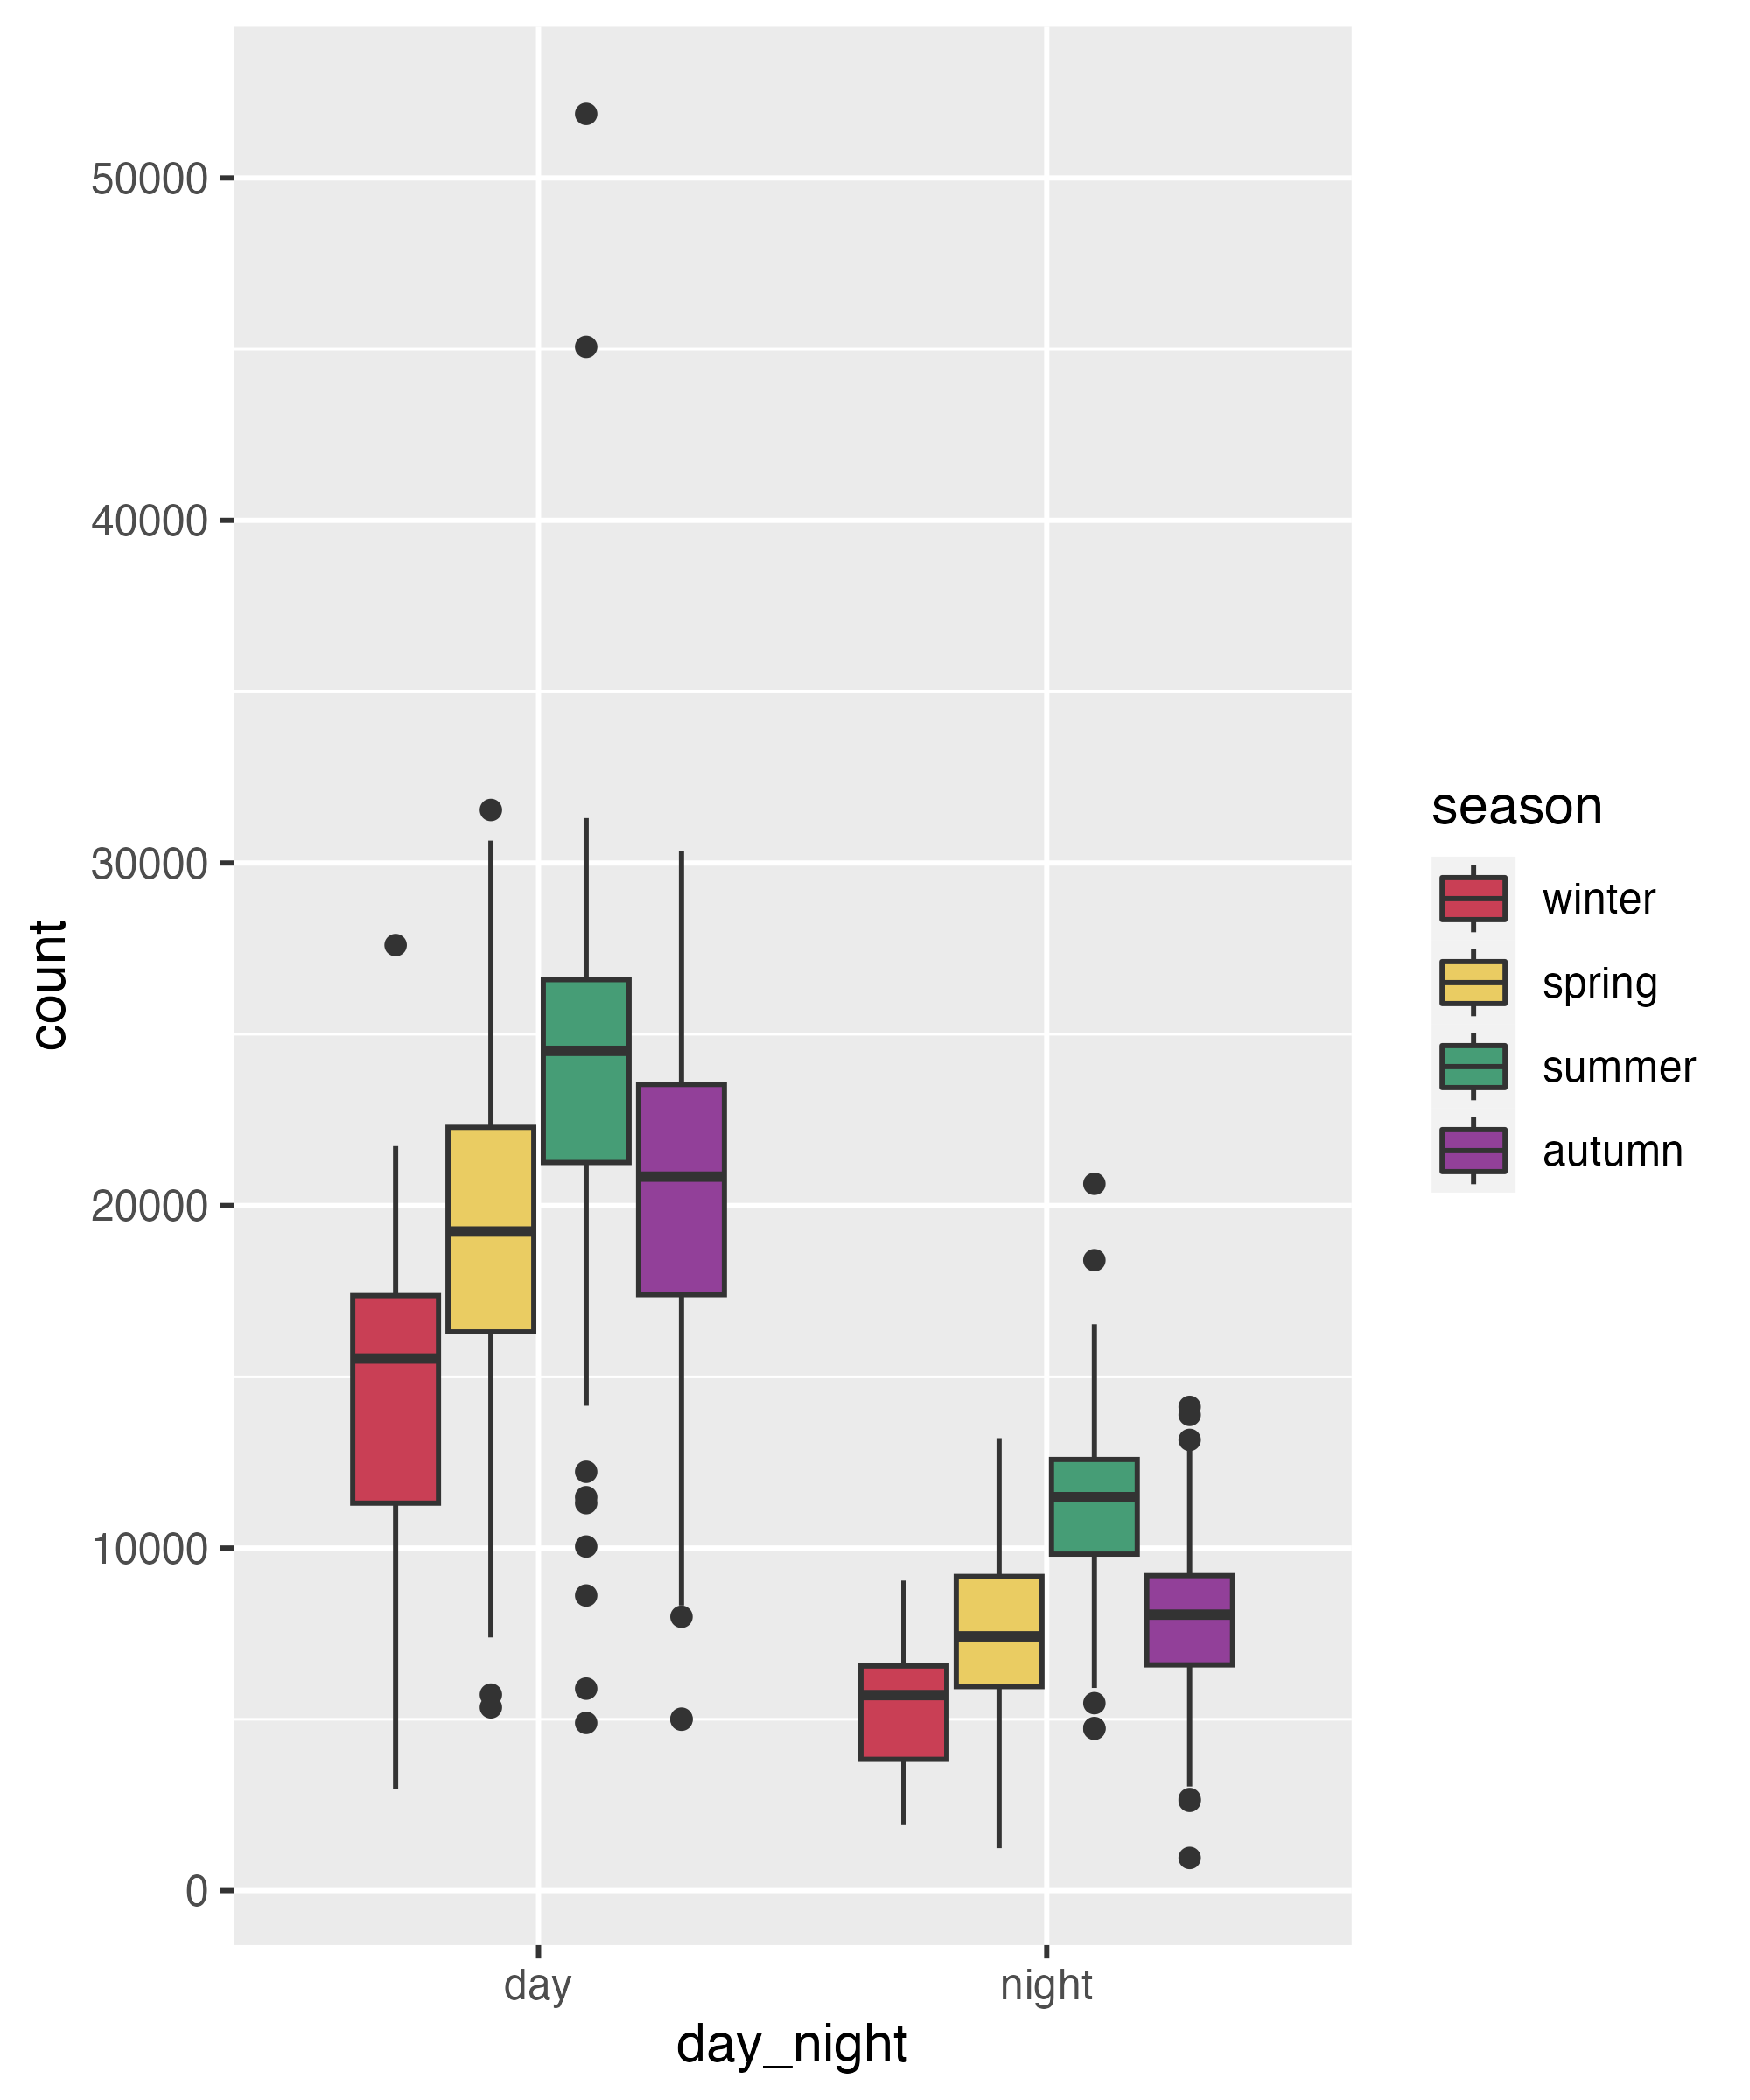
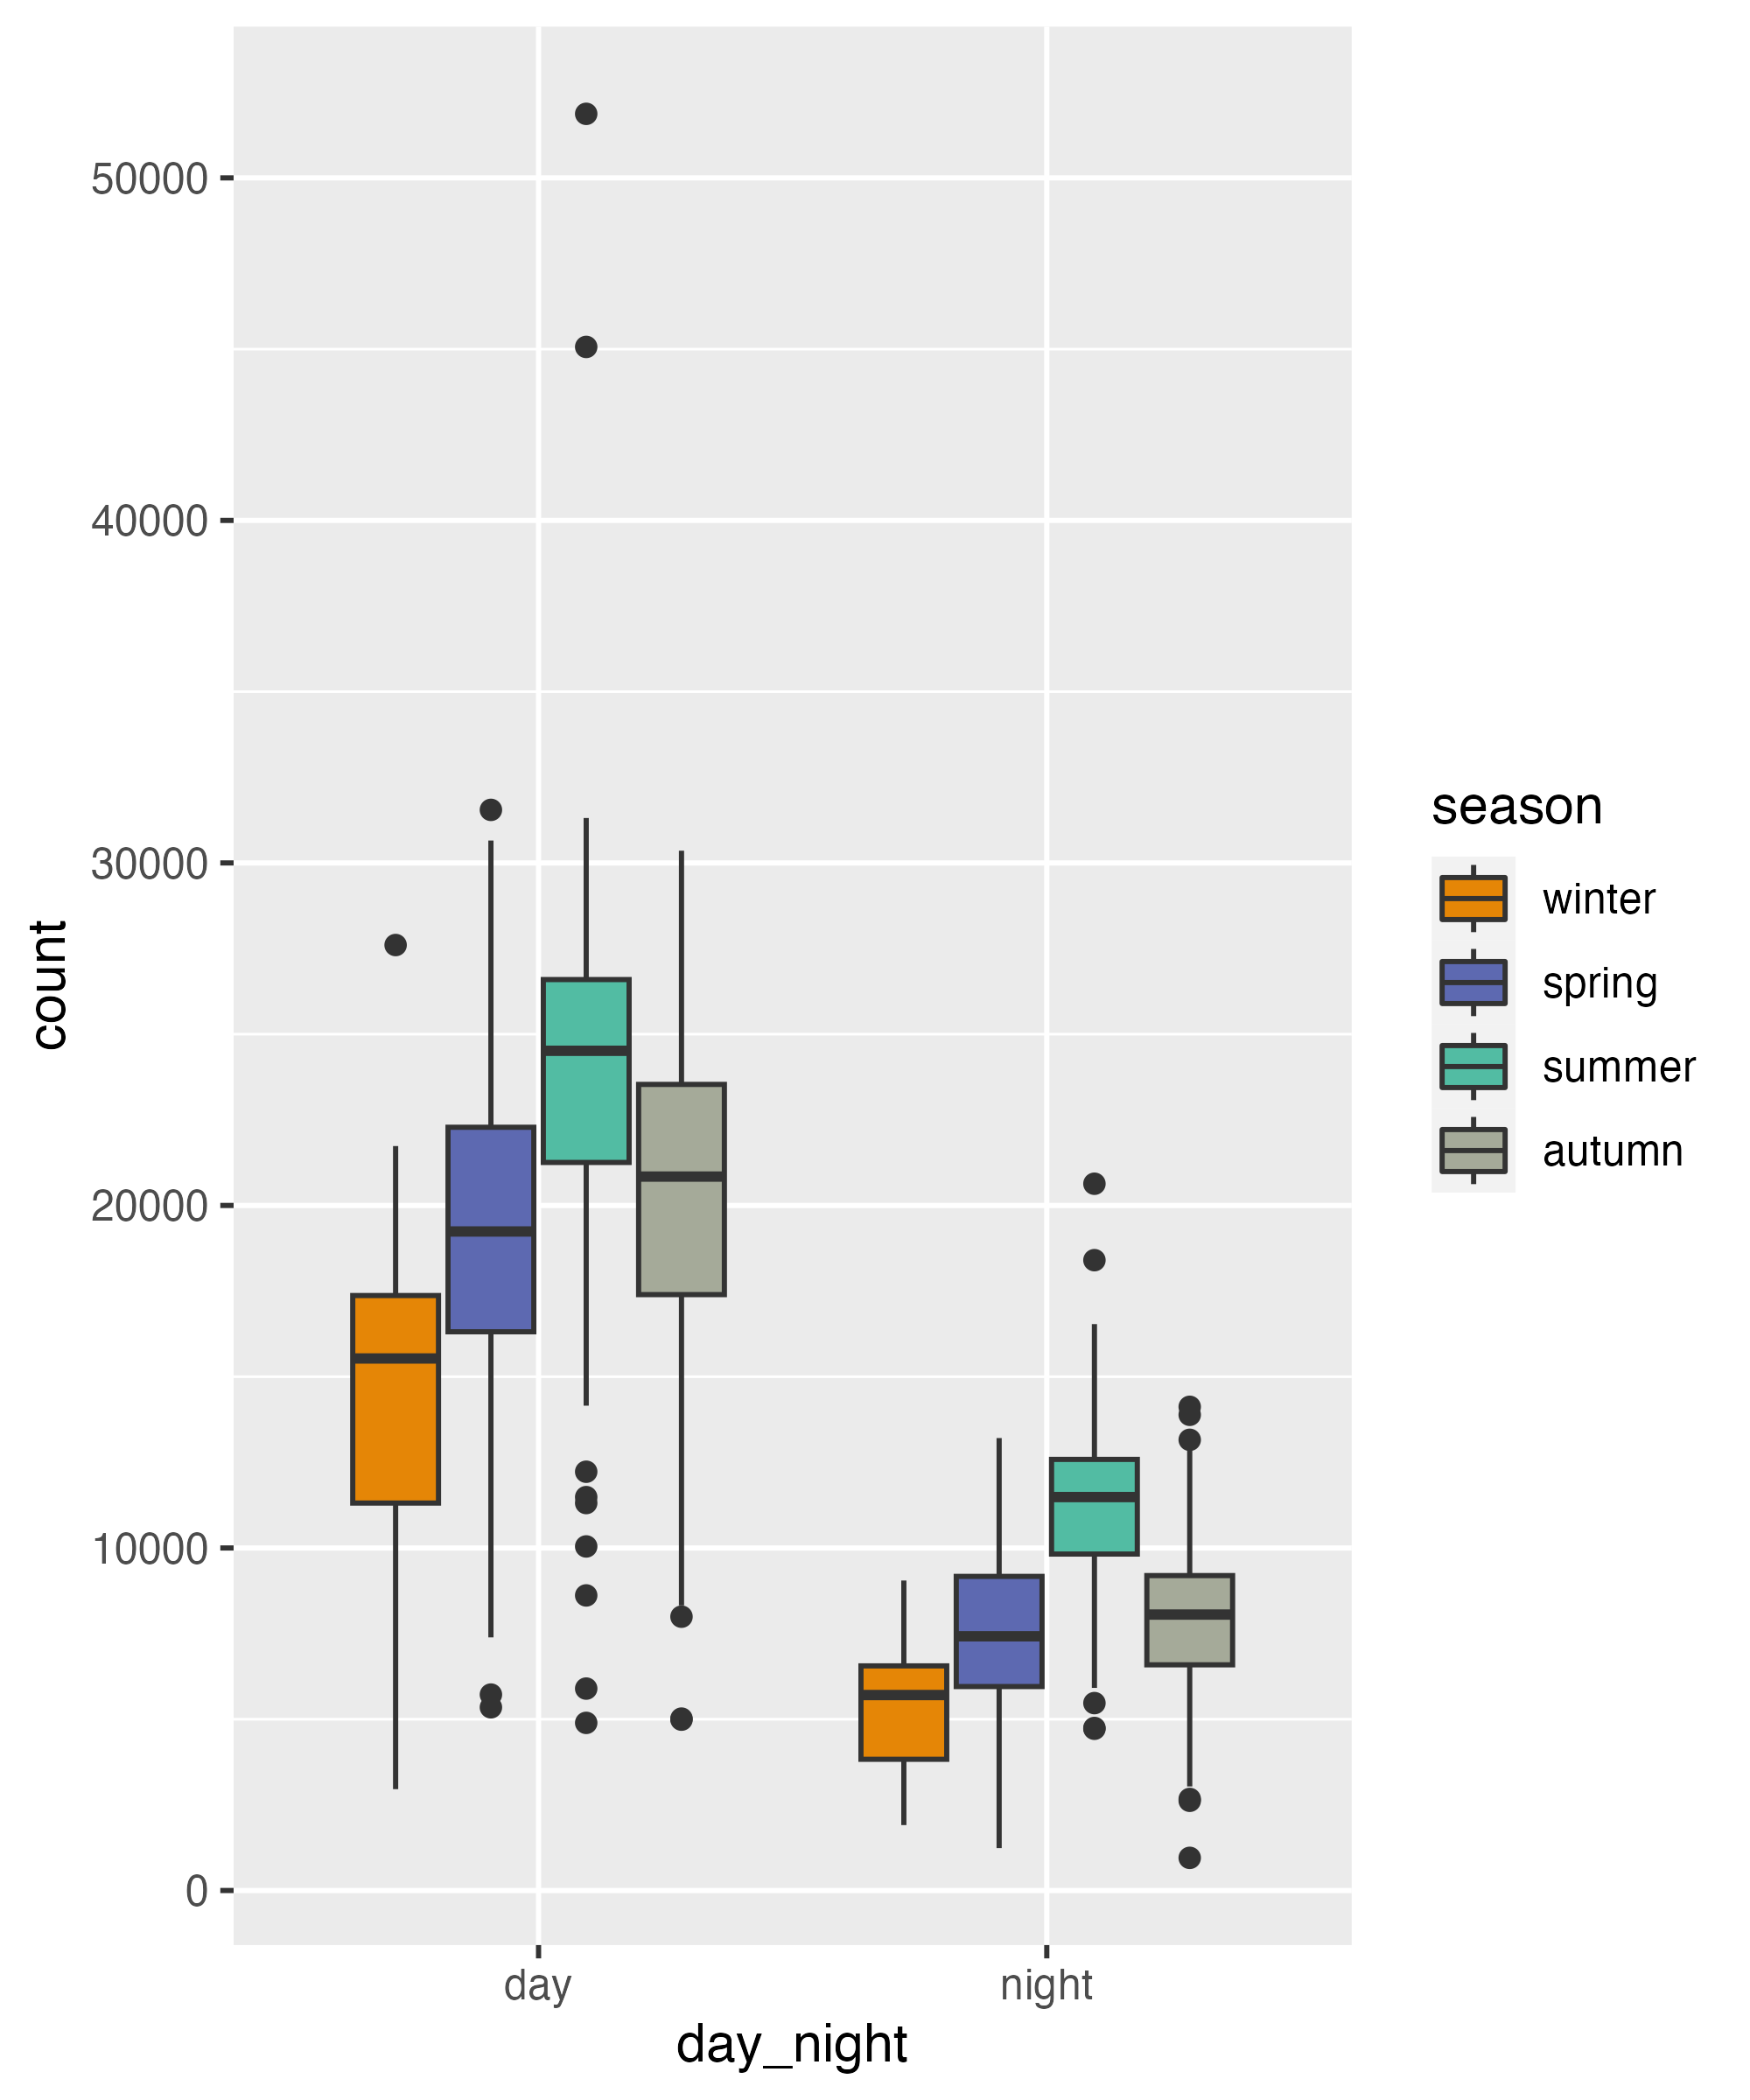
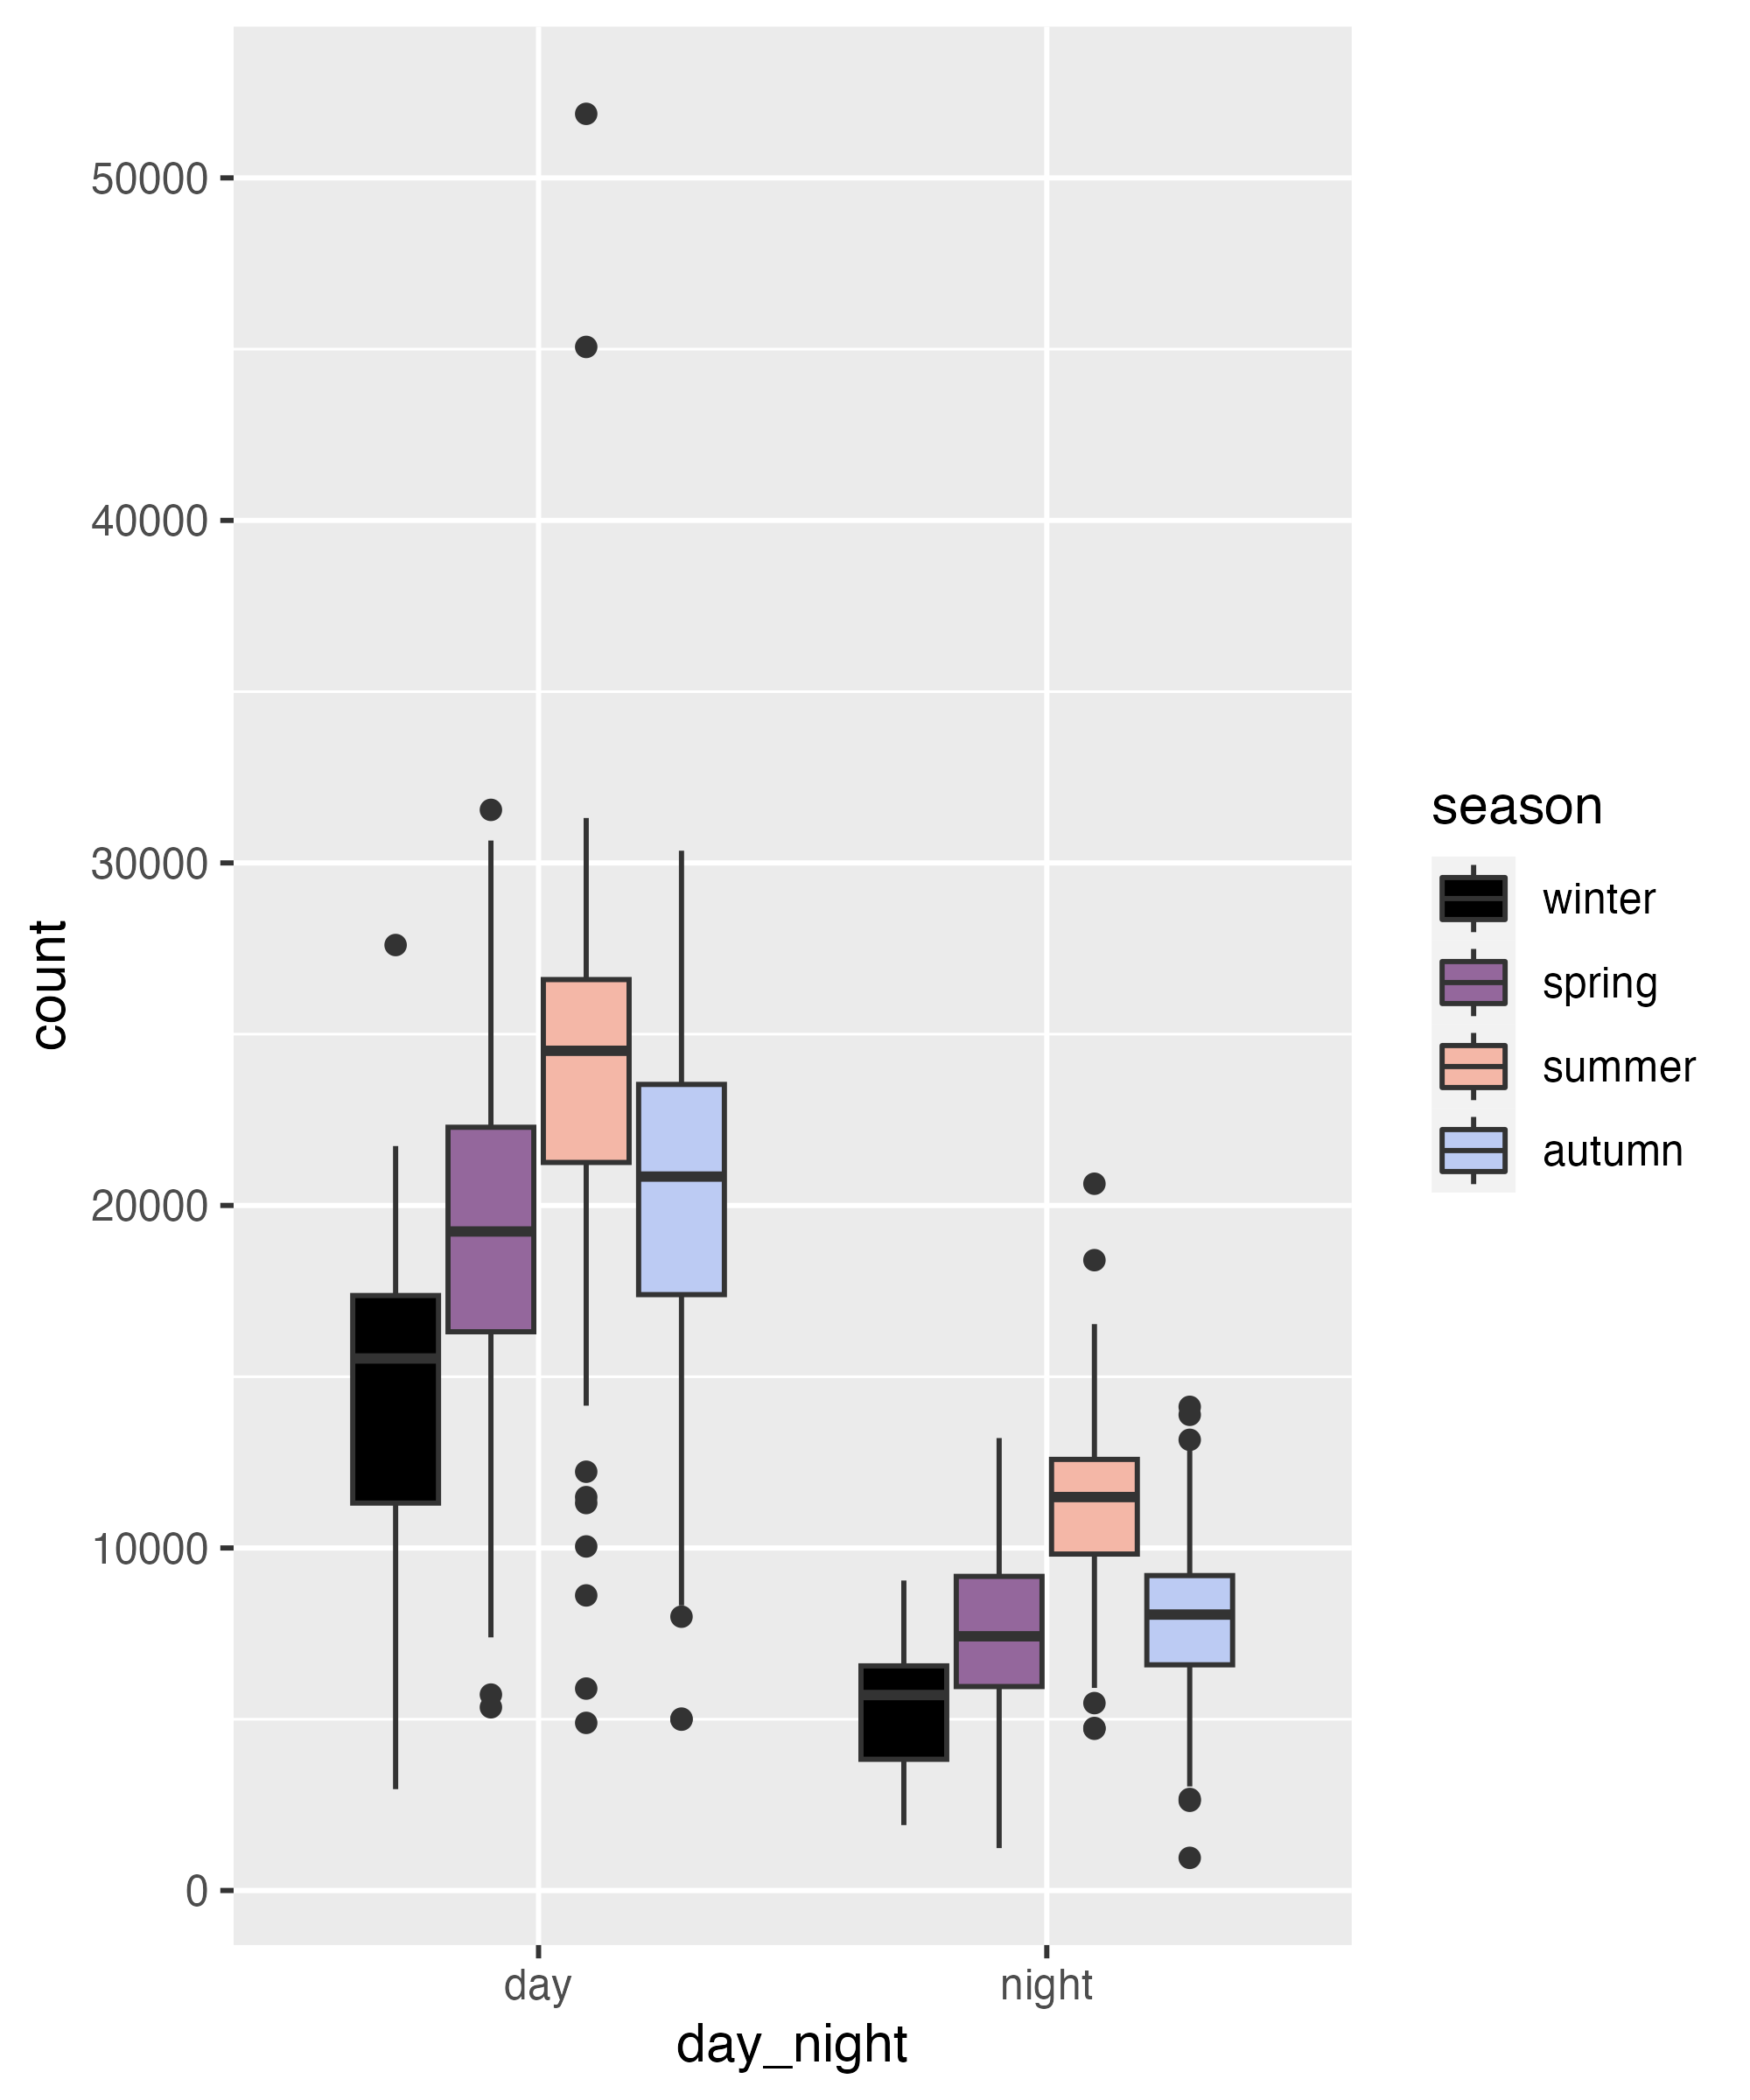
ggplot(
    bikes,
    aes(x = day_night, y = count)
  ) +
  geom_boxplot(
    aes(color = season,
        fill = after_scale(
          lighten(color, .8)
        ))
  ) +
  geom_jitter(
    aes(color = season,
        color = after_scale(
          darken(color, .3)
    )),
    position = position_jitterdodge(
      dodge.width = .75,
      jitter.width = .2
    ),
    alpha = .4
  ) +
  scale_color_manual(
    values = carto_custom
  )
Customize Existing Palettes
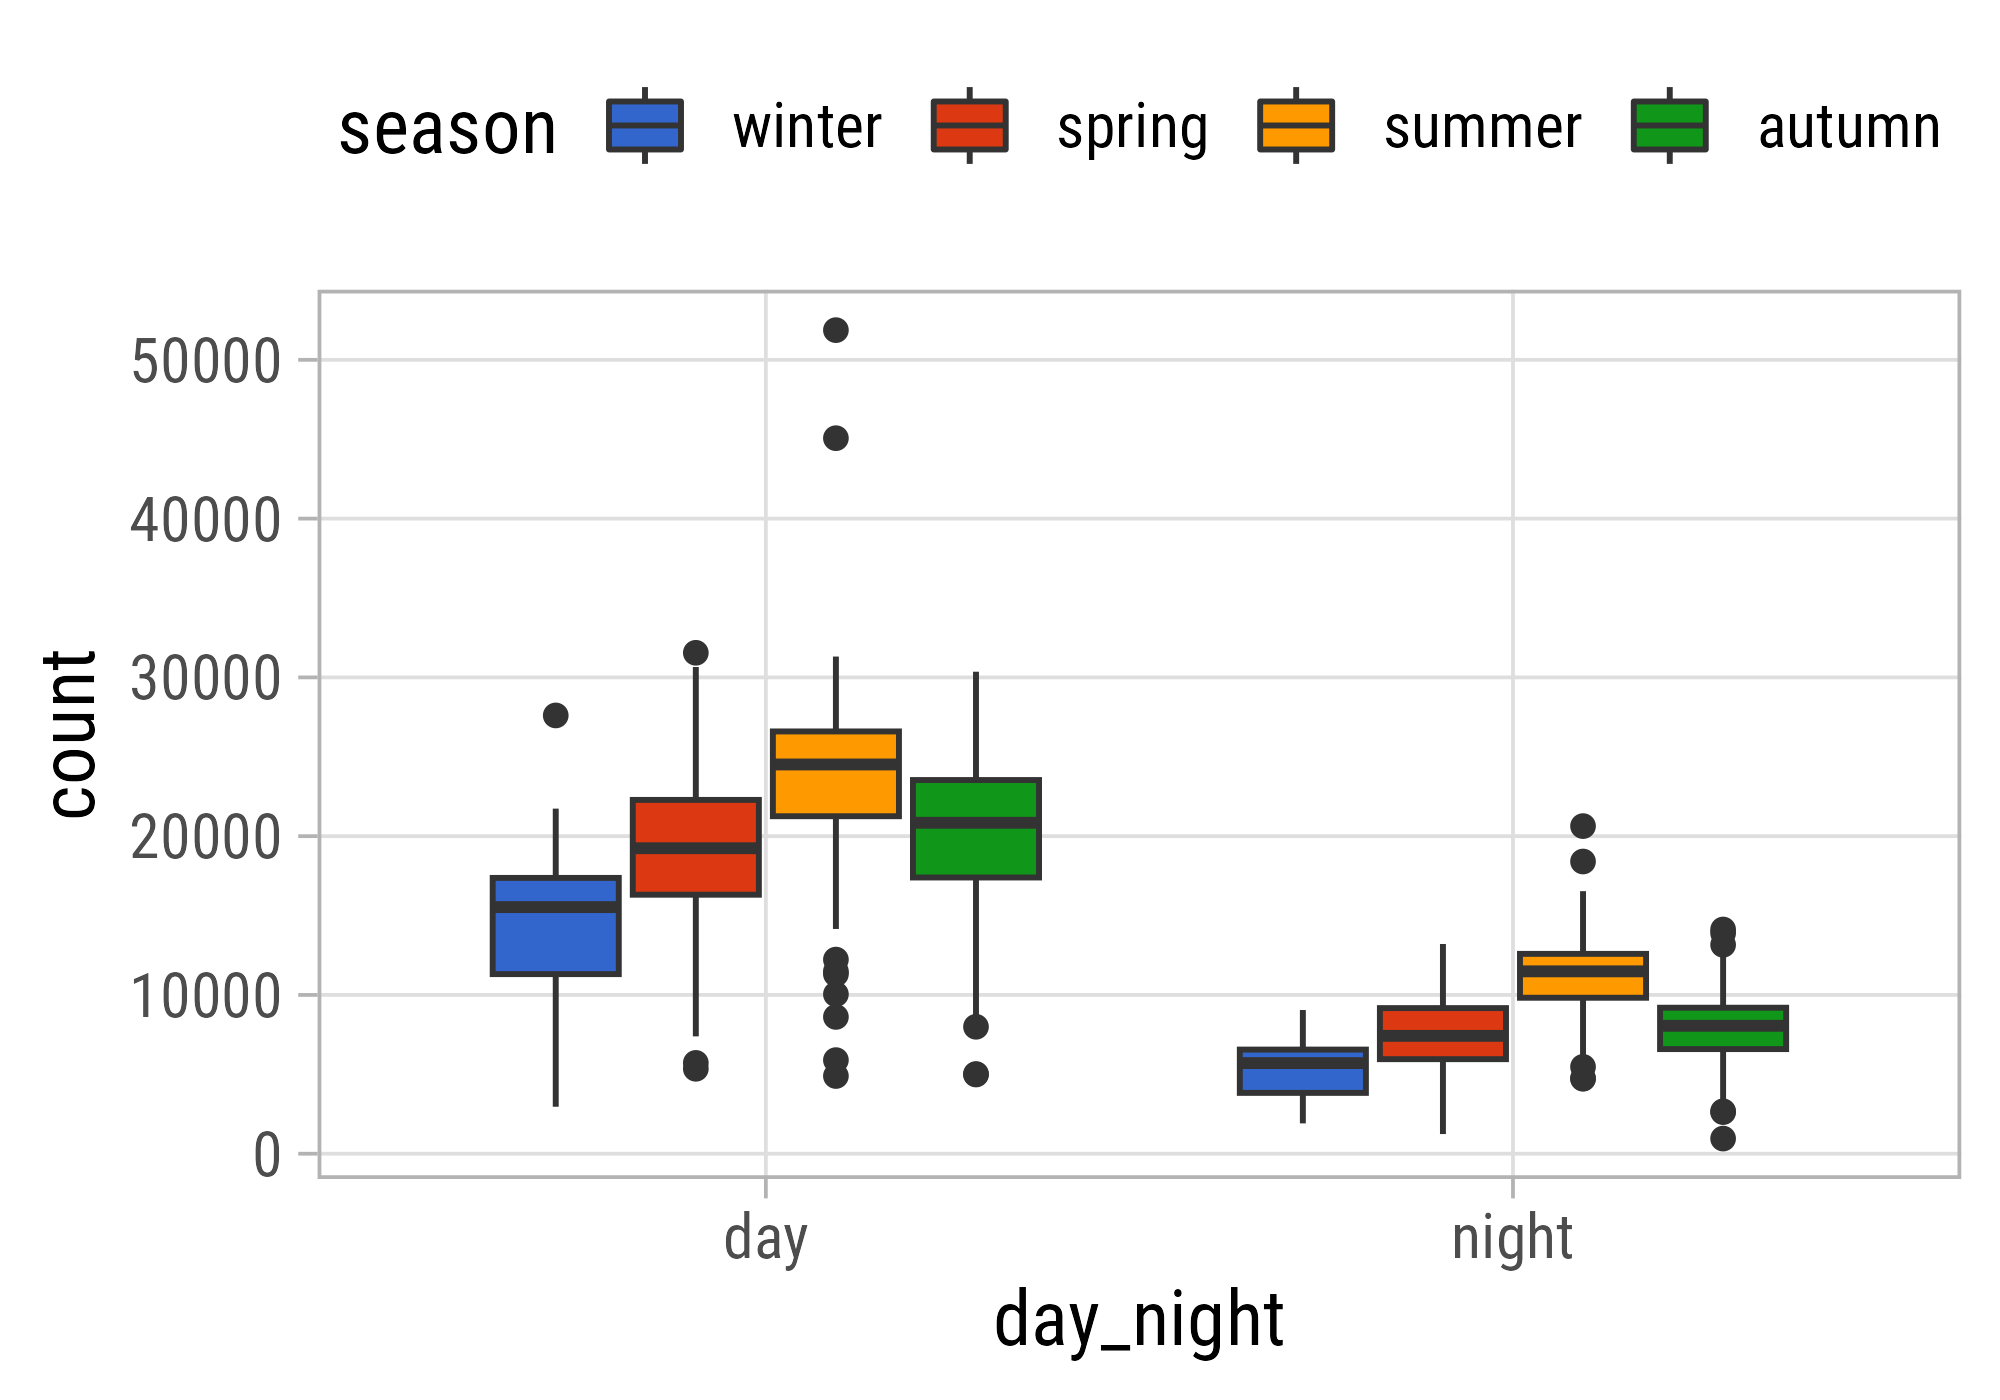
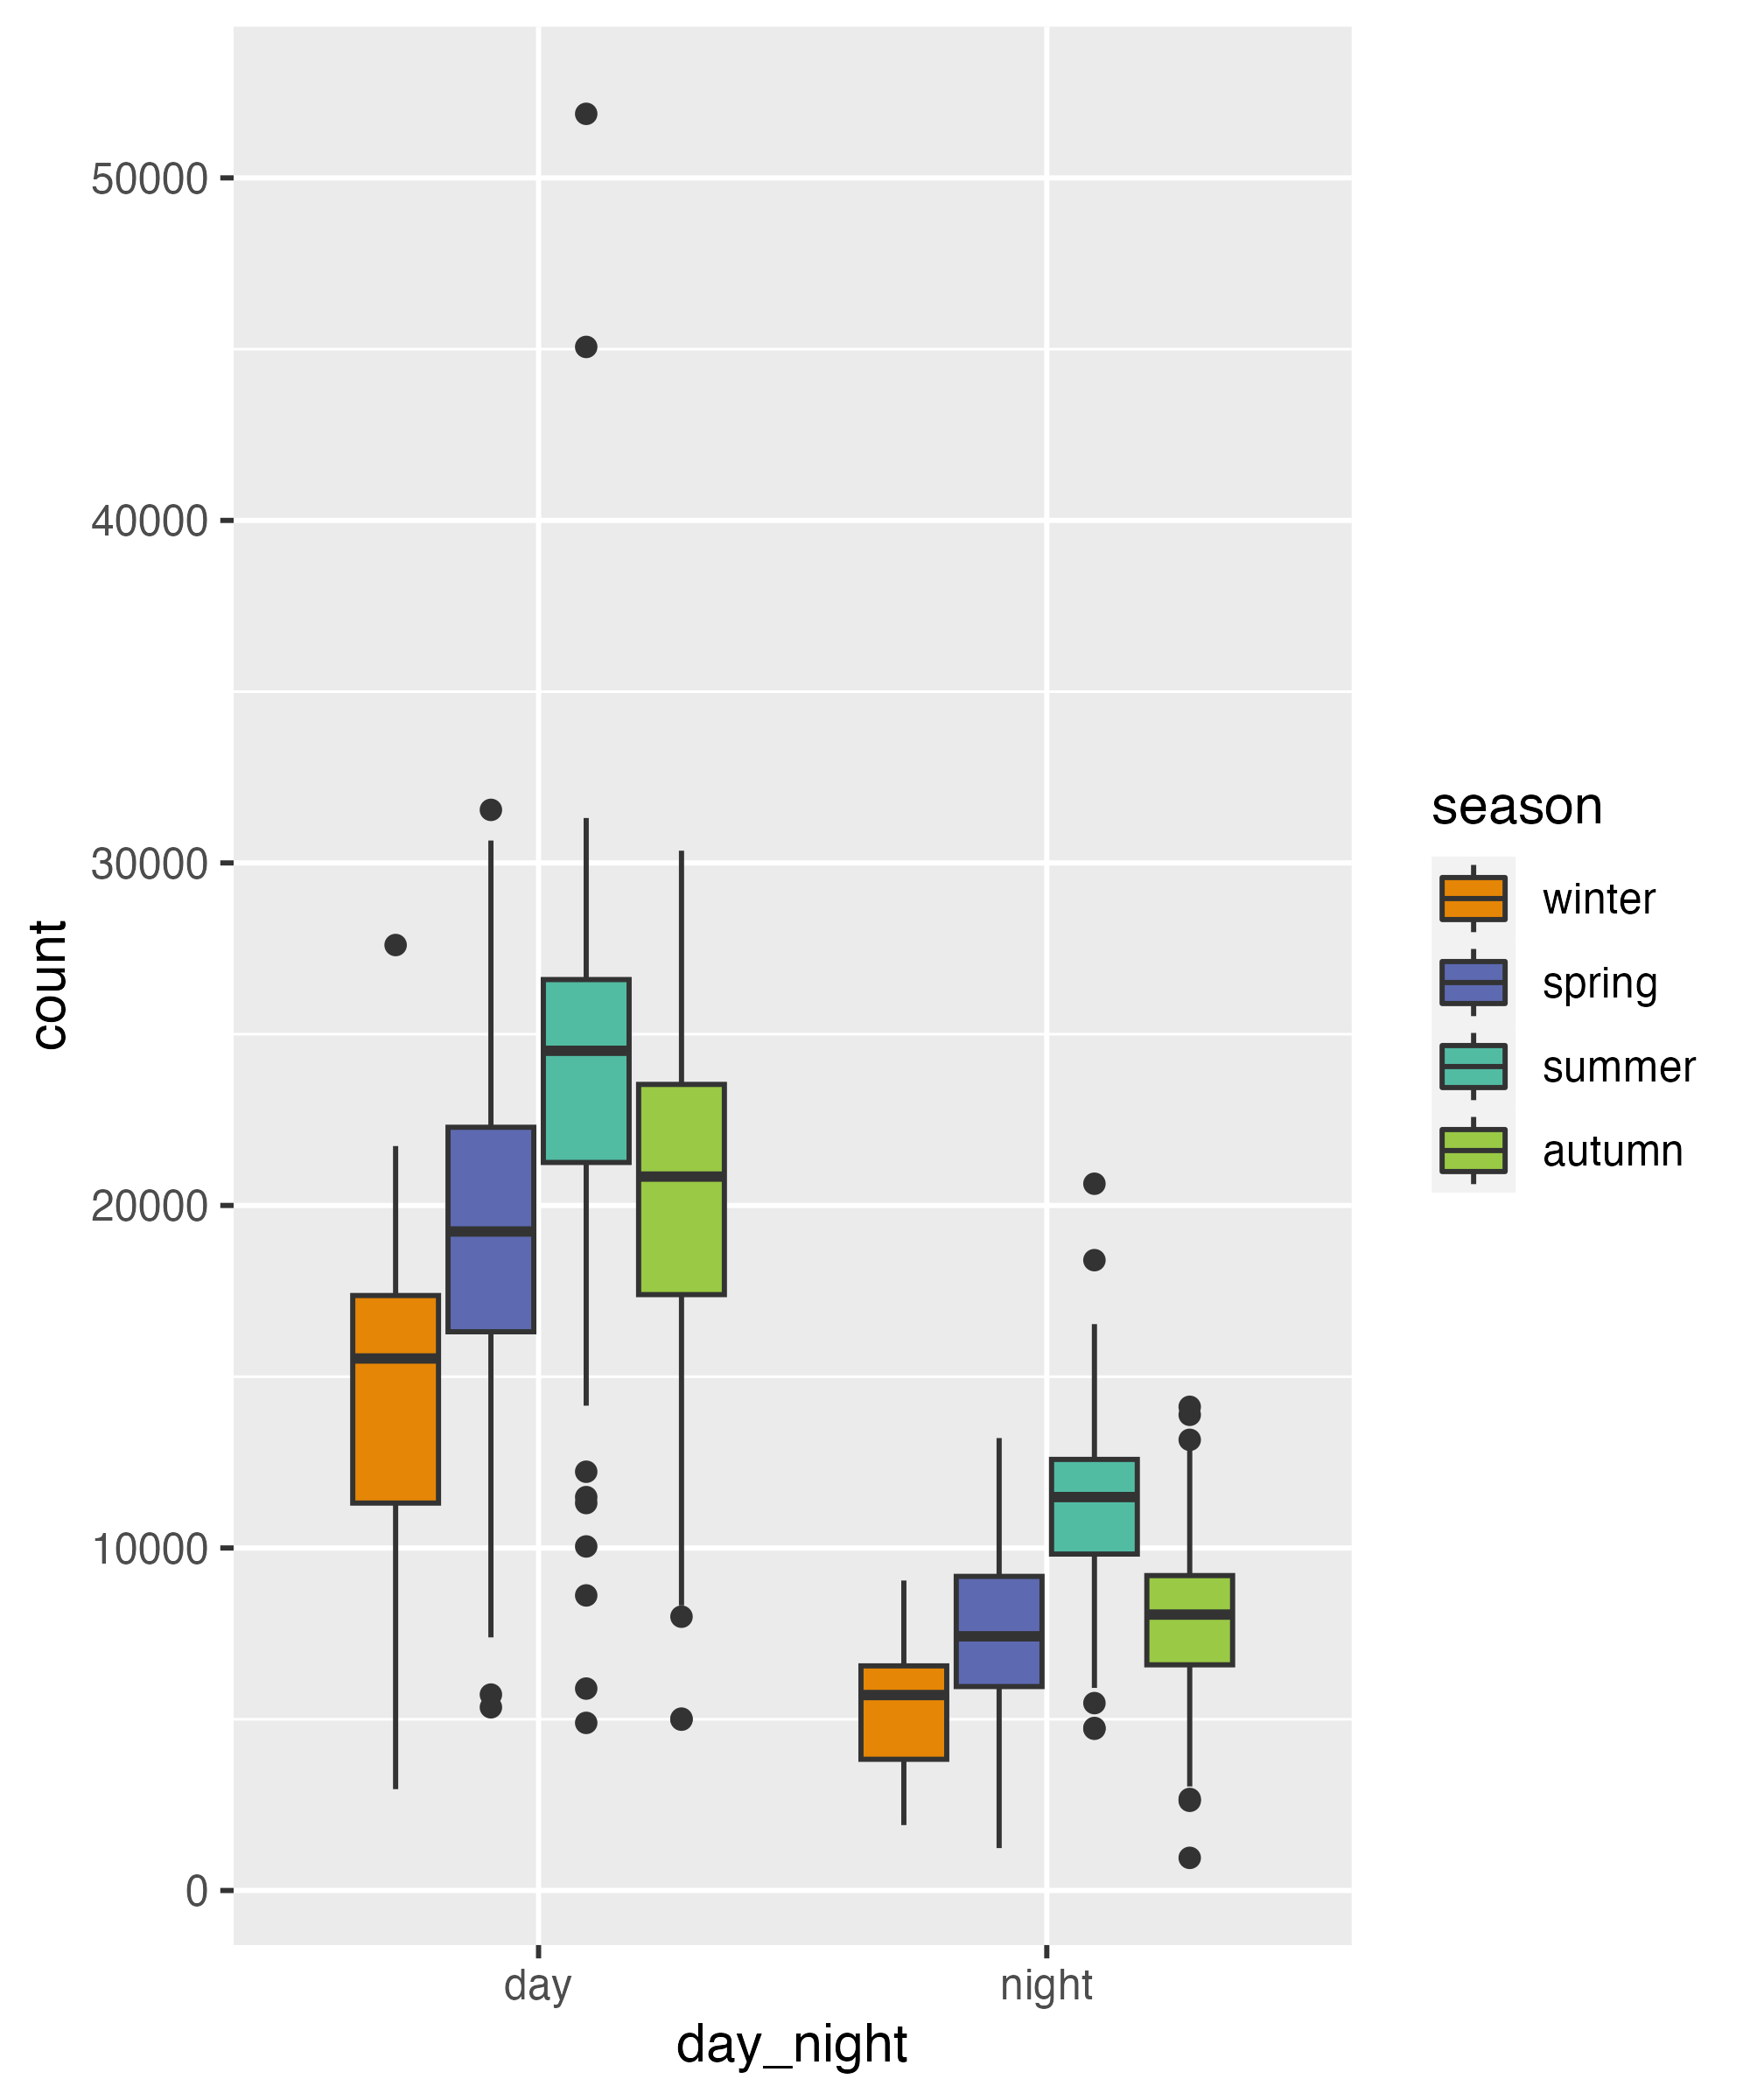
ggplot(
    bikes,
    aes(x = day_night, y = count)
  ) +
  geom_boxplot(
    aes(color = season,
        fill = after_scale(
          lighten(color, .8)
        ))
  ) +
  geom_jitter(
    aes(color = season,
        color = after_scale(
          darken(color, .3)
        )),
    position = position_jitterdodge(
      dodge.width = .75,
      jitter.width = .2
    ),
    alpha = .4
  ) +
  scale_color_manual(
    values = carto_custom
  )
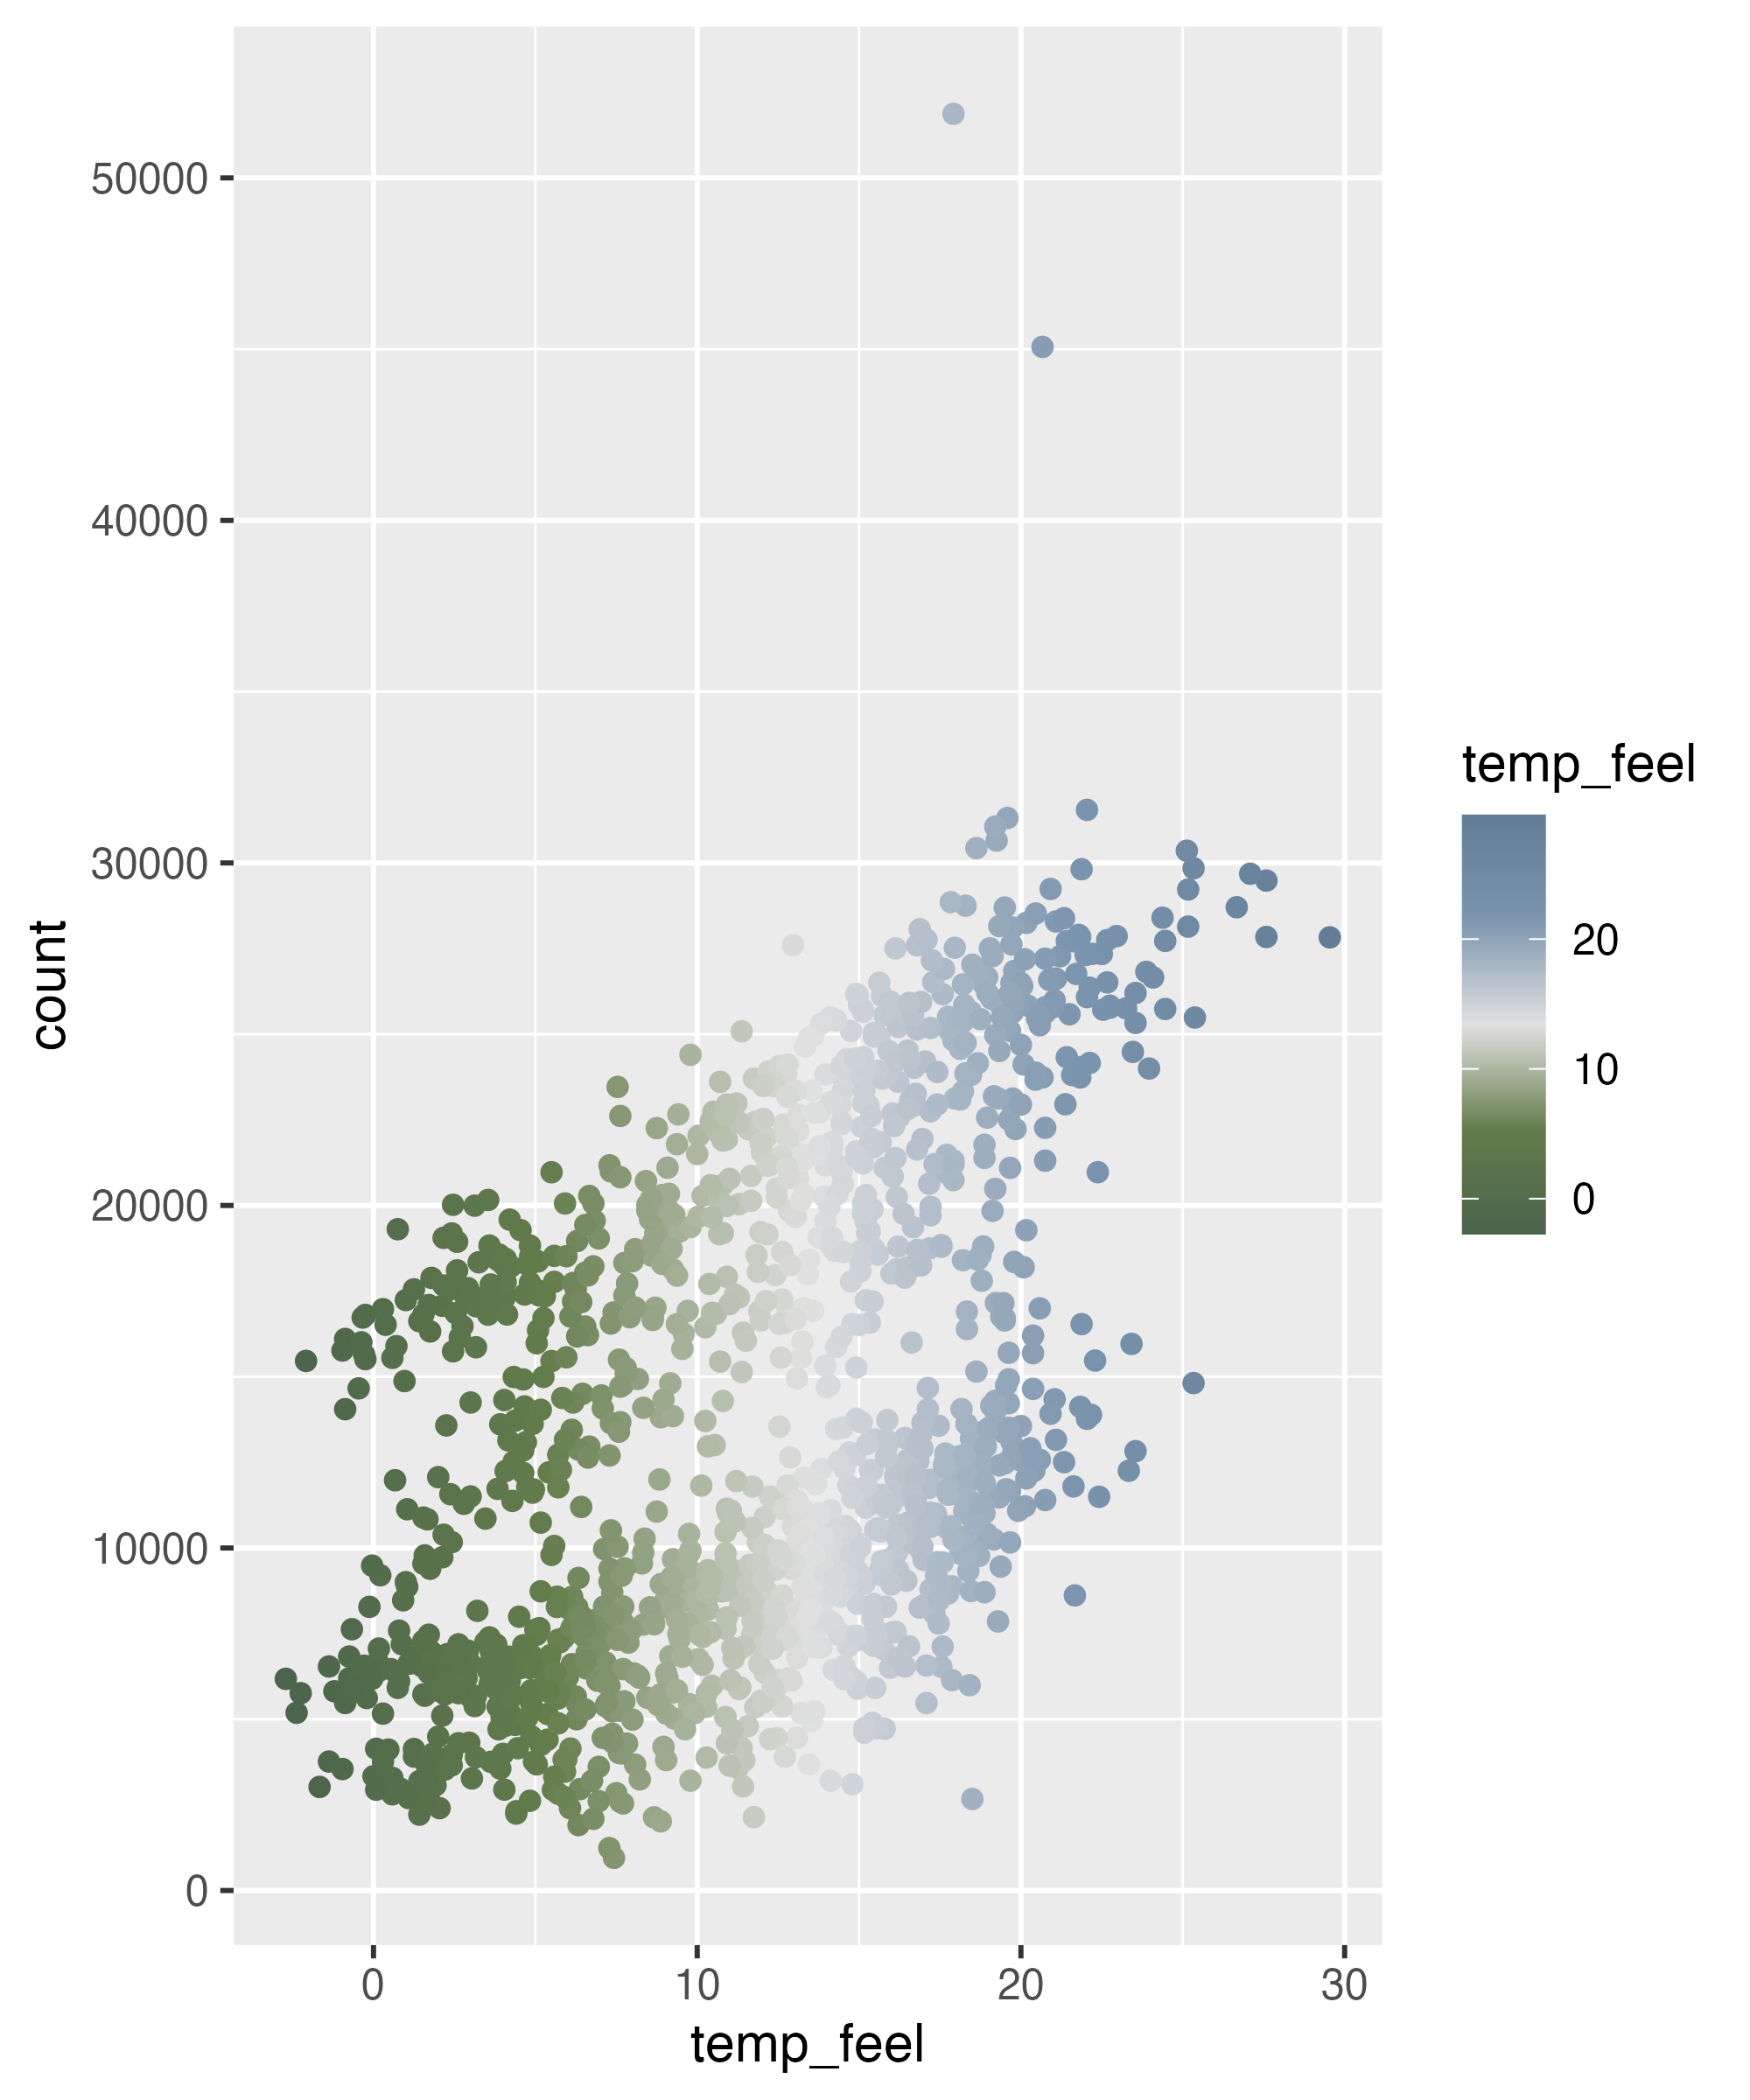
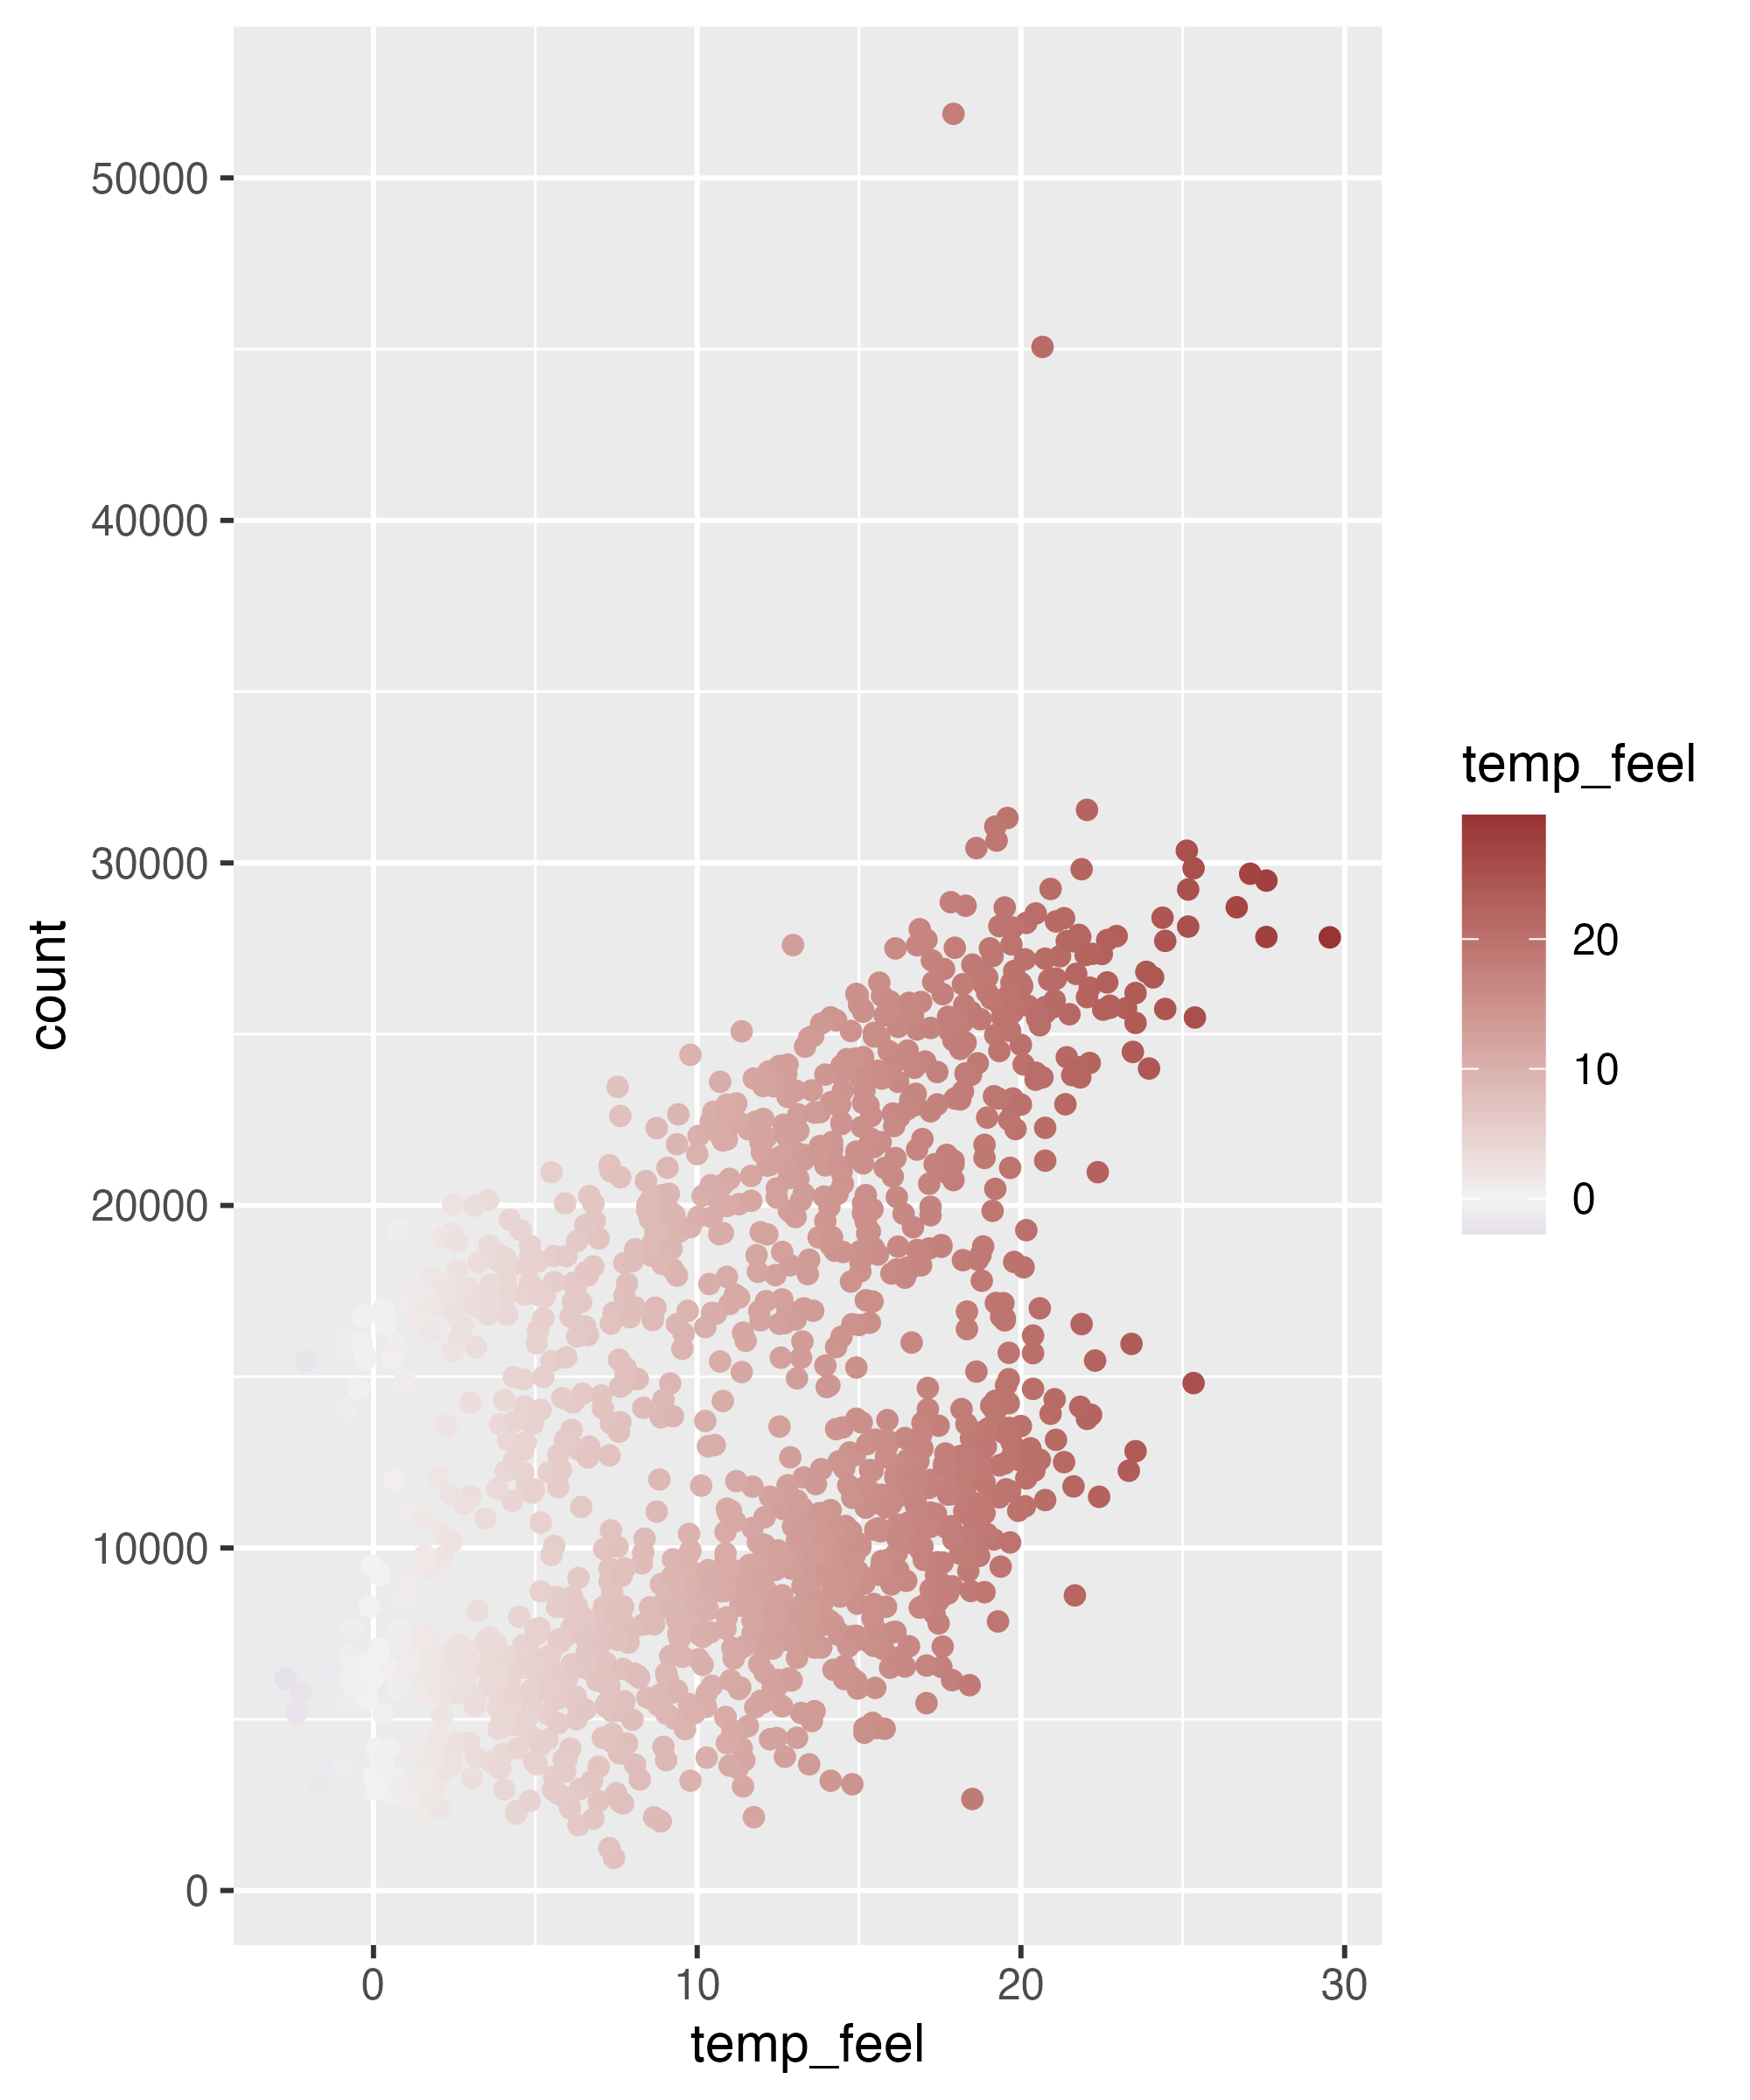
Create Sequential Palettes

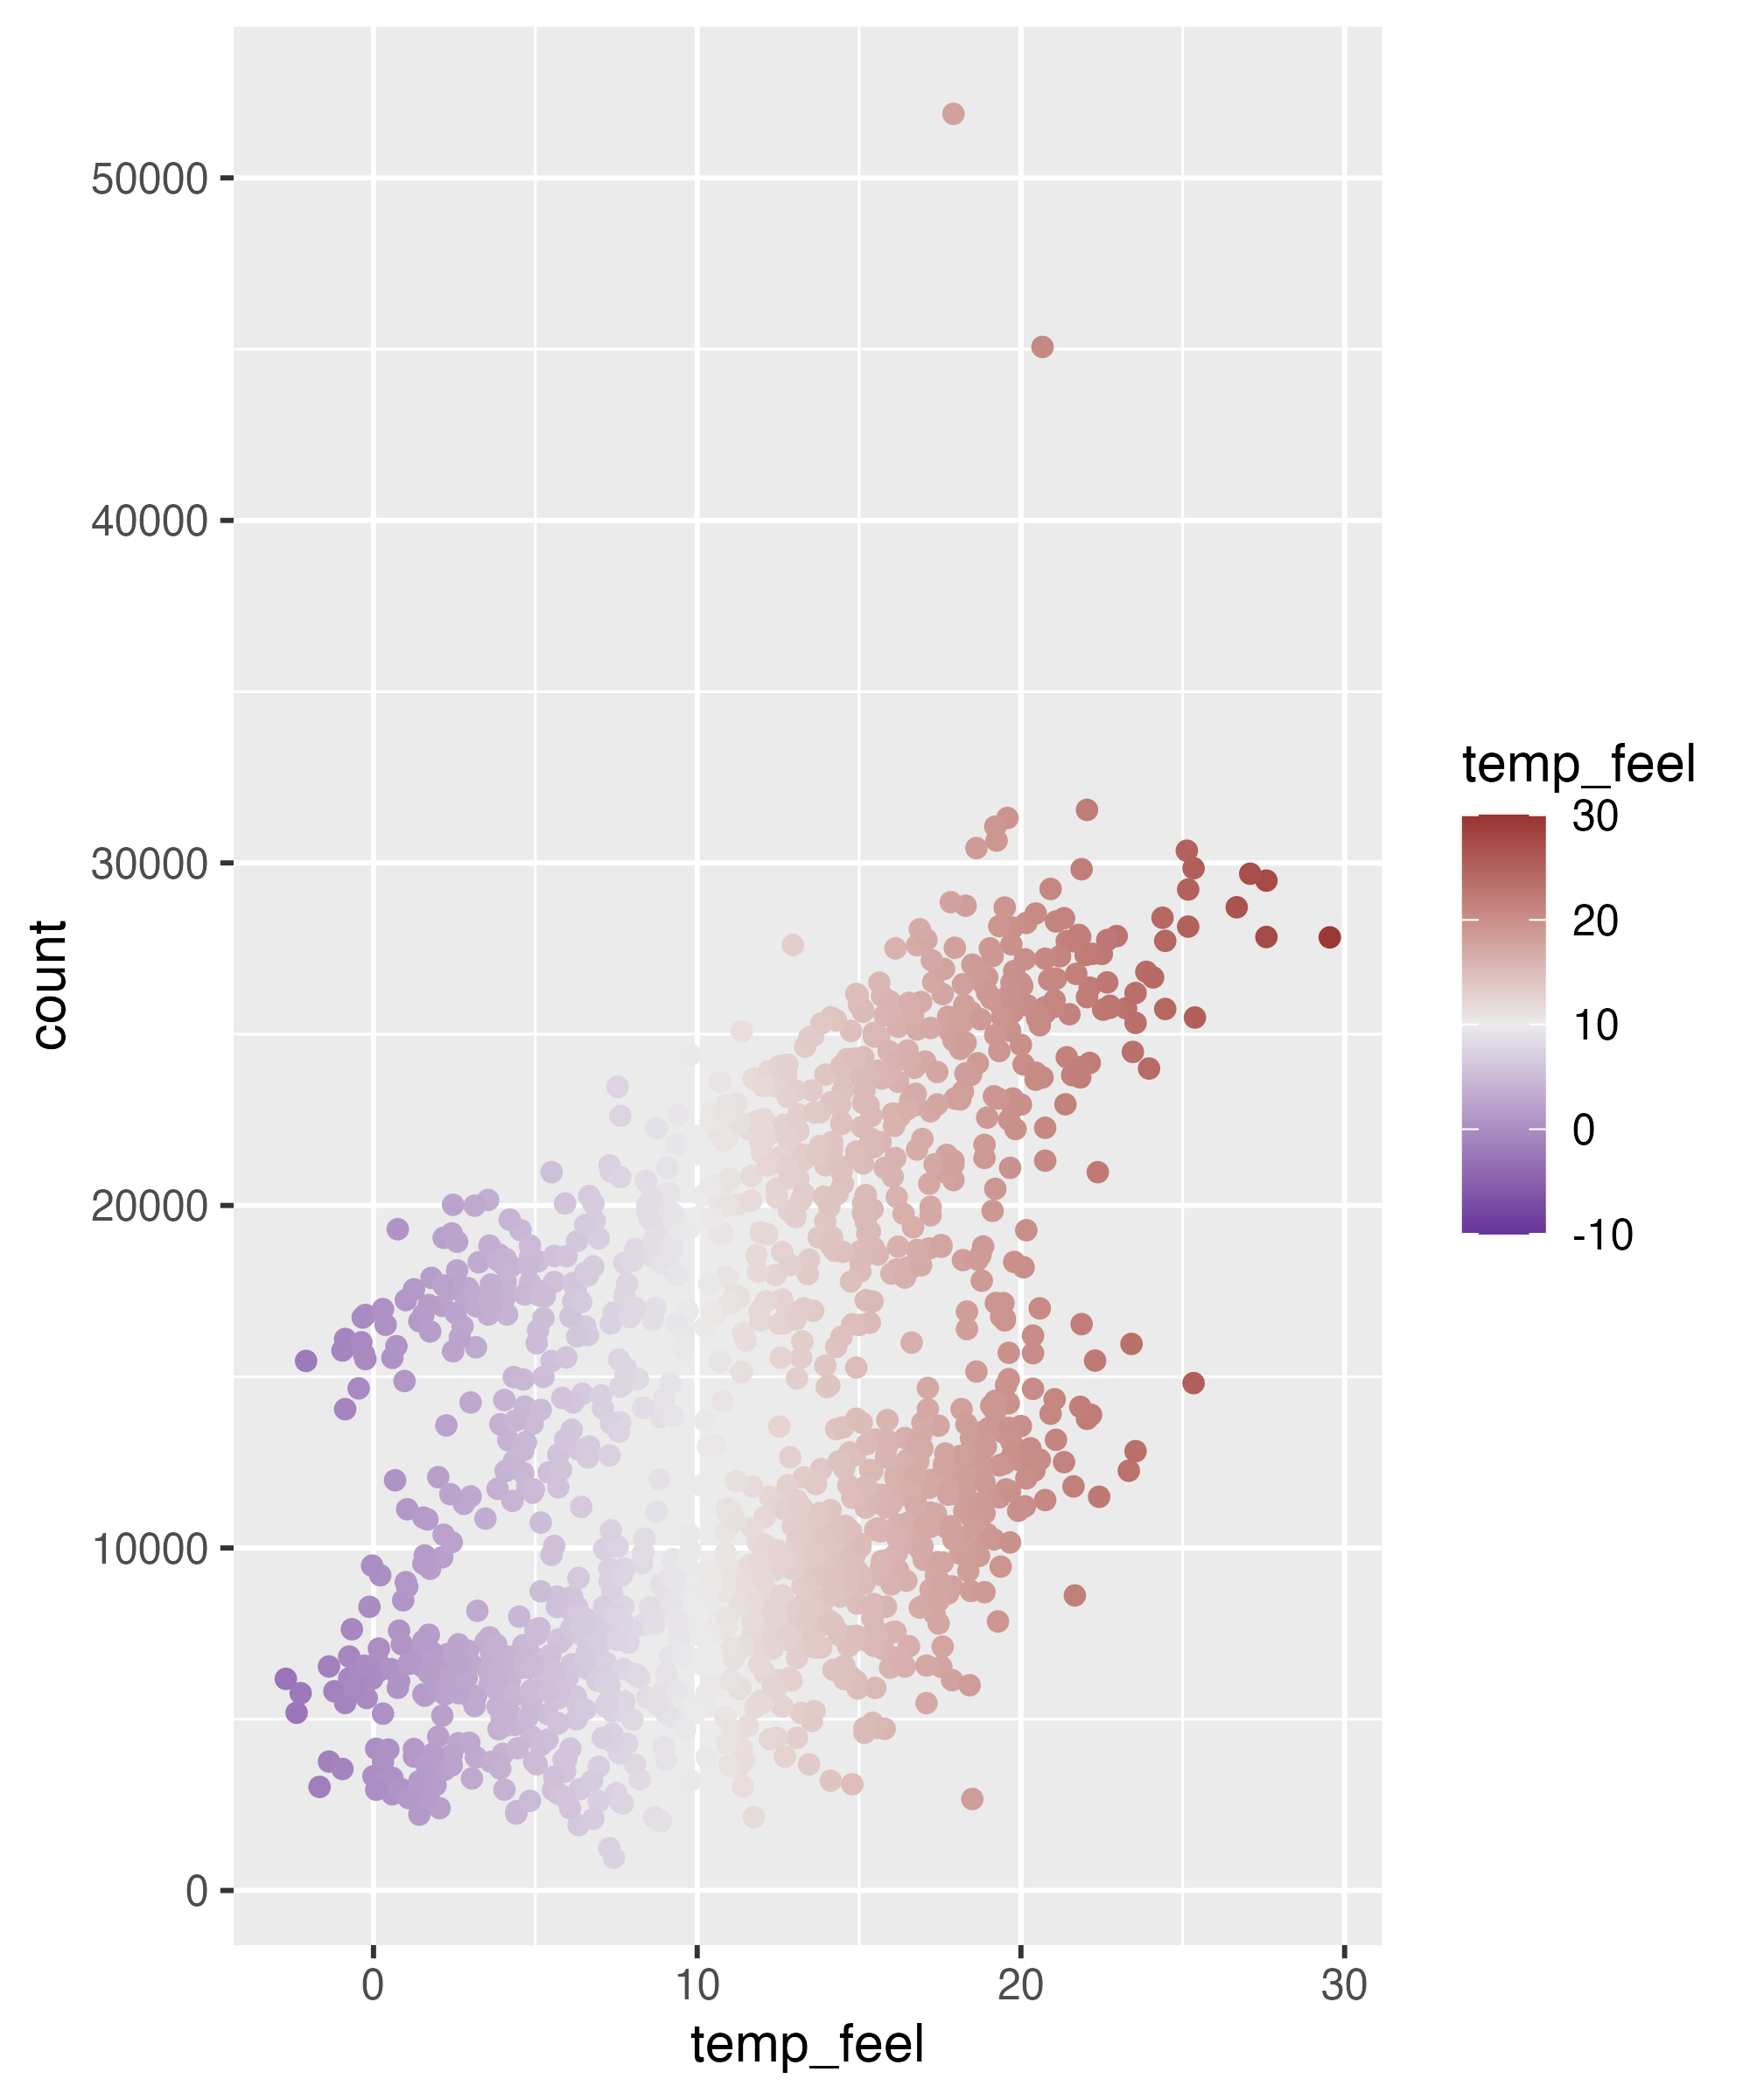
Create Diverging Palettes
Create Diverging Palettes
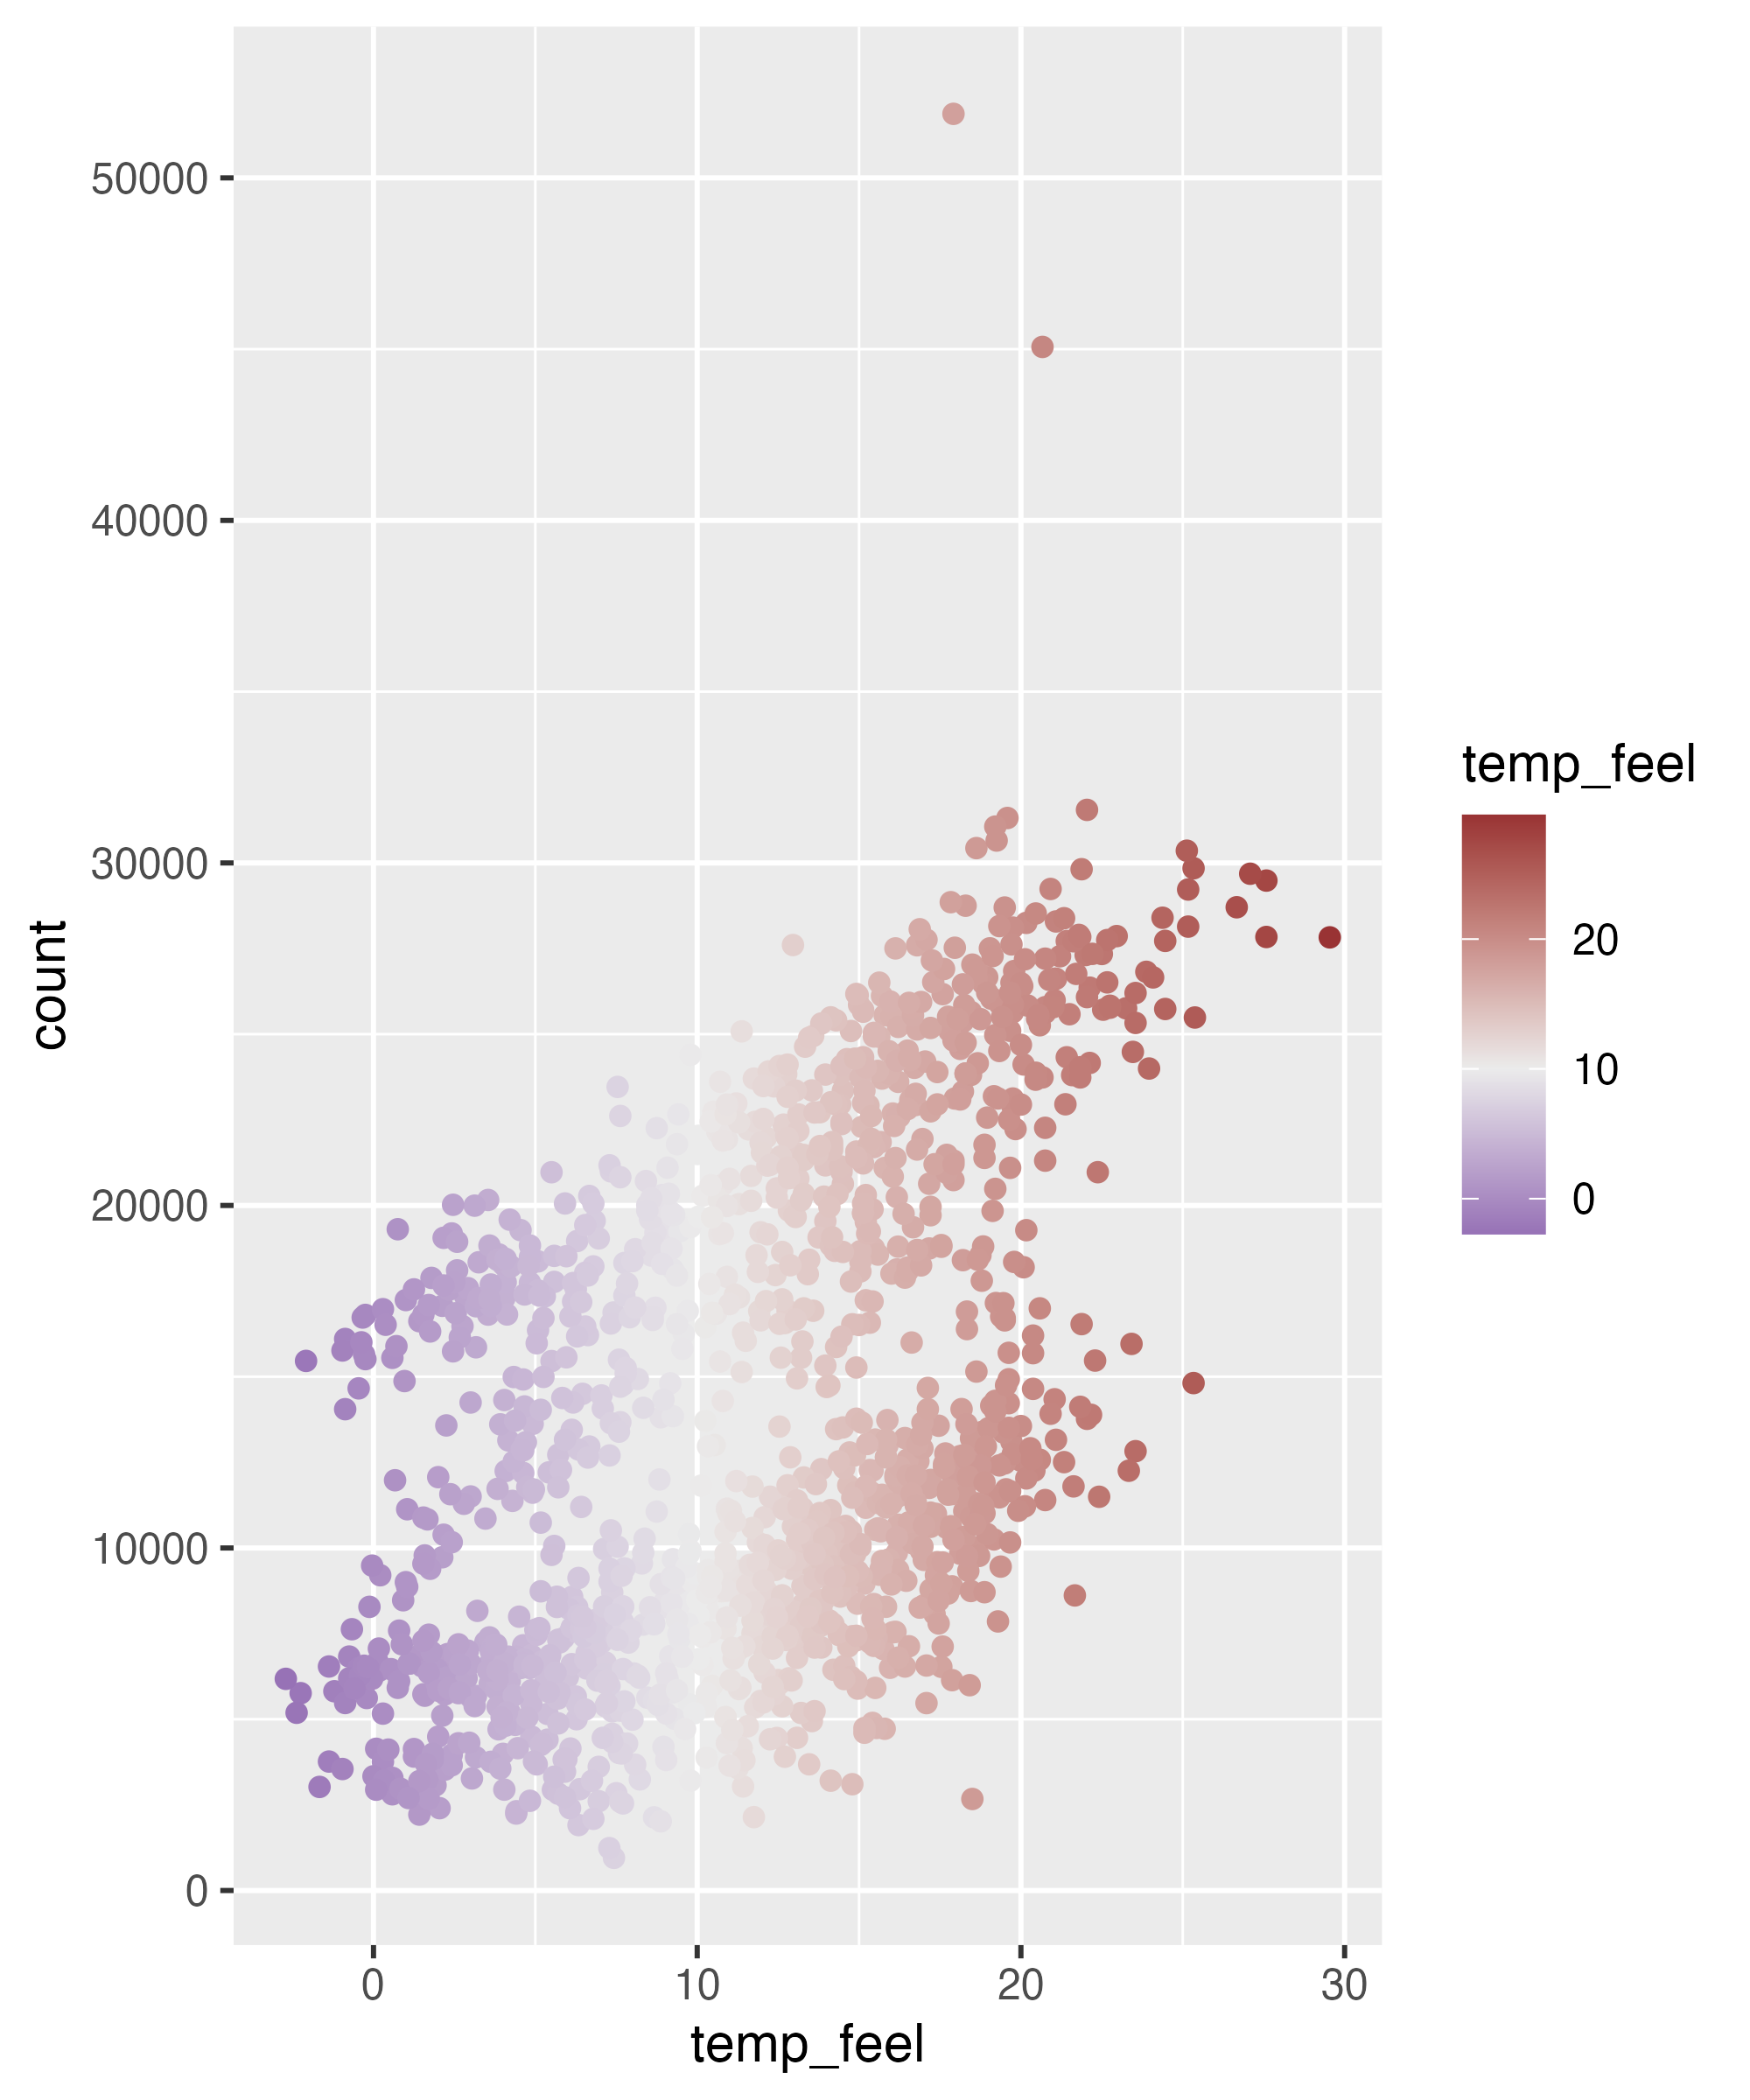
Create Diverging Palettes
Create Any Palette

Create Any Palette
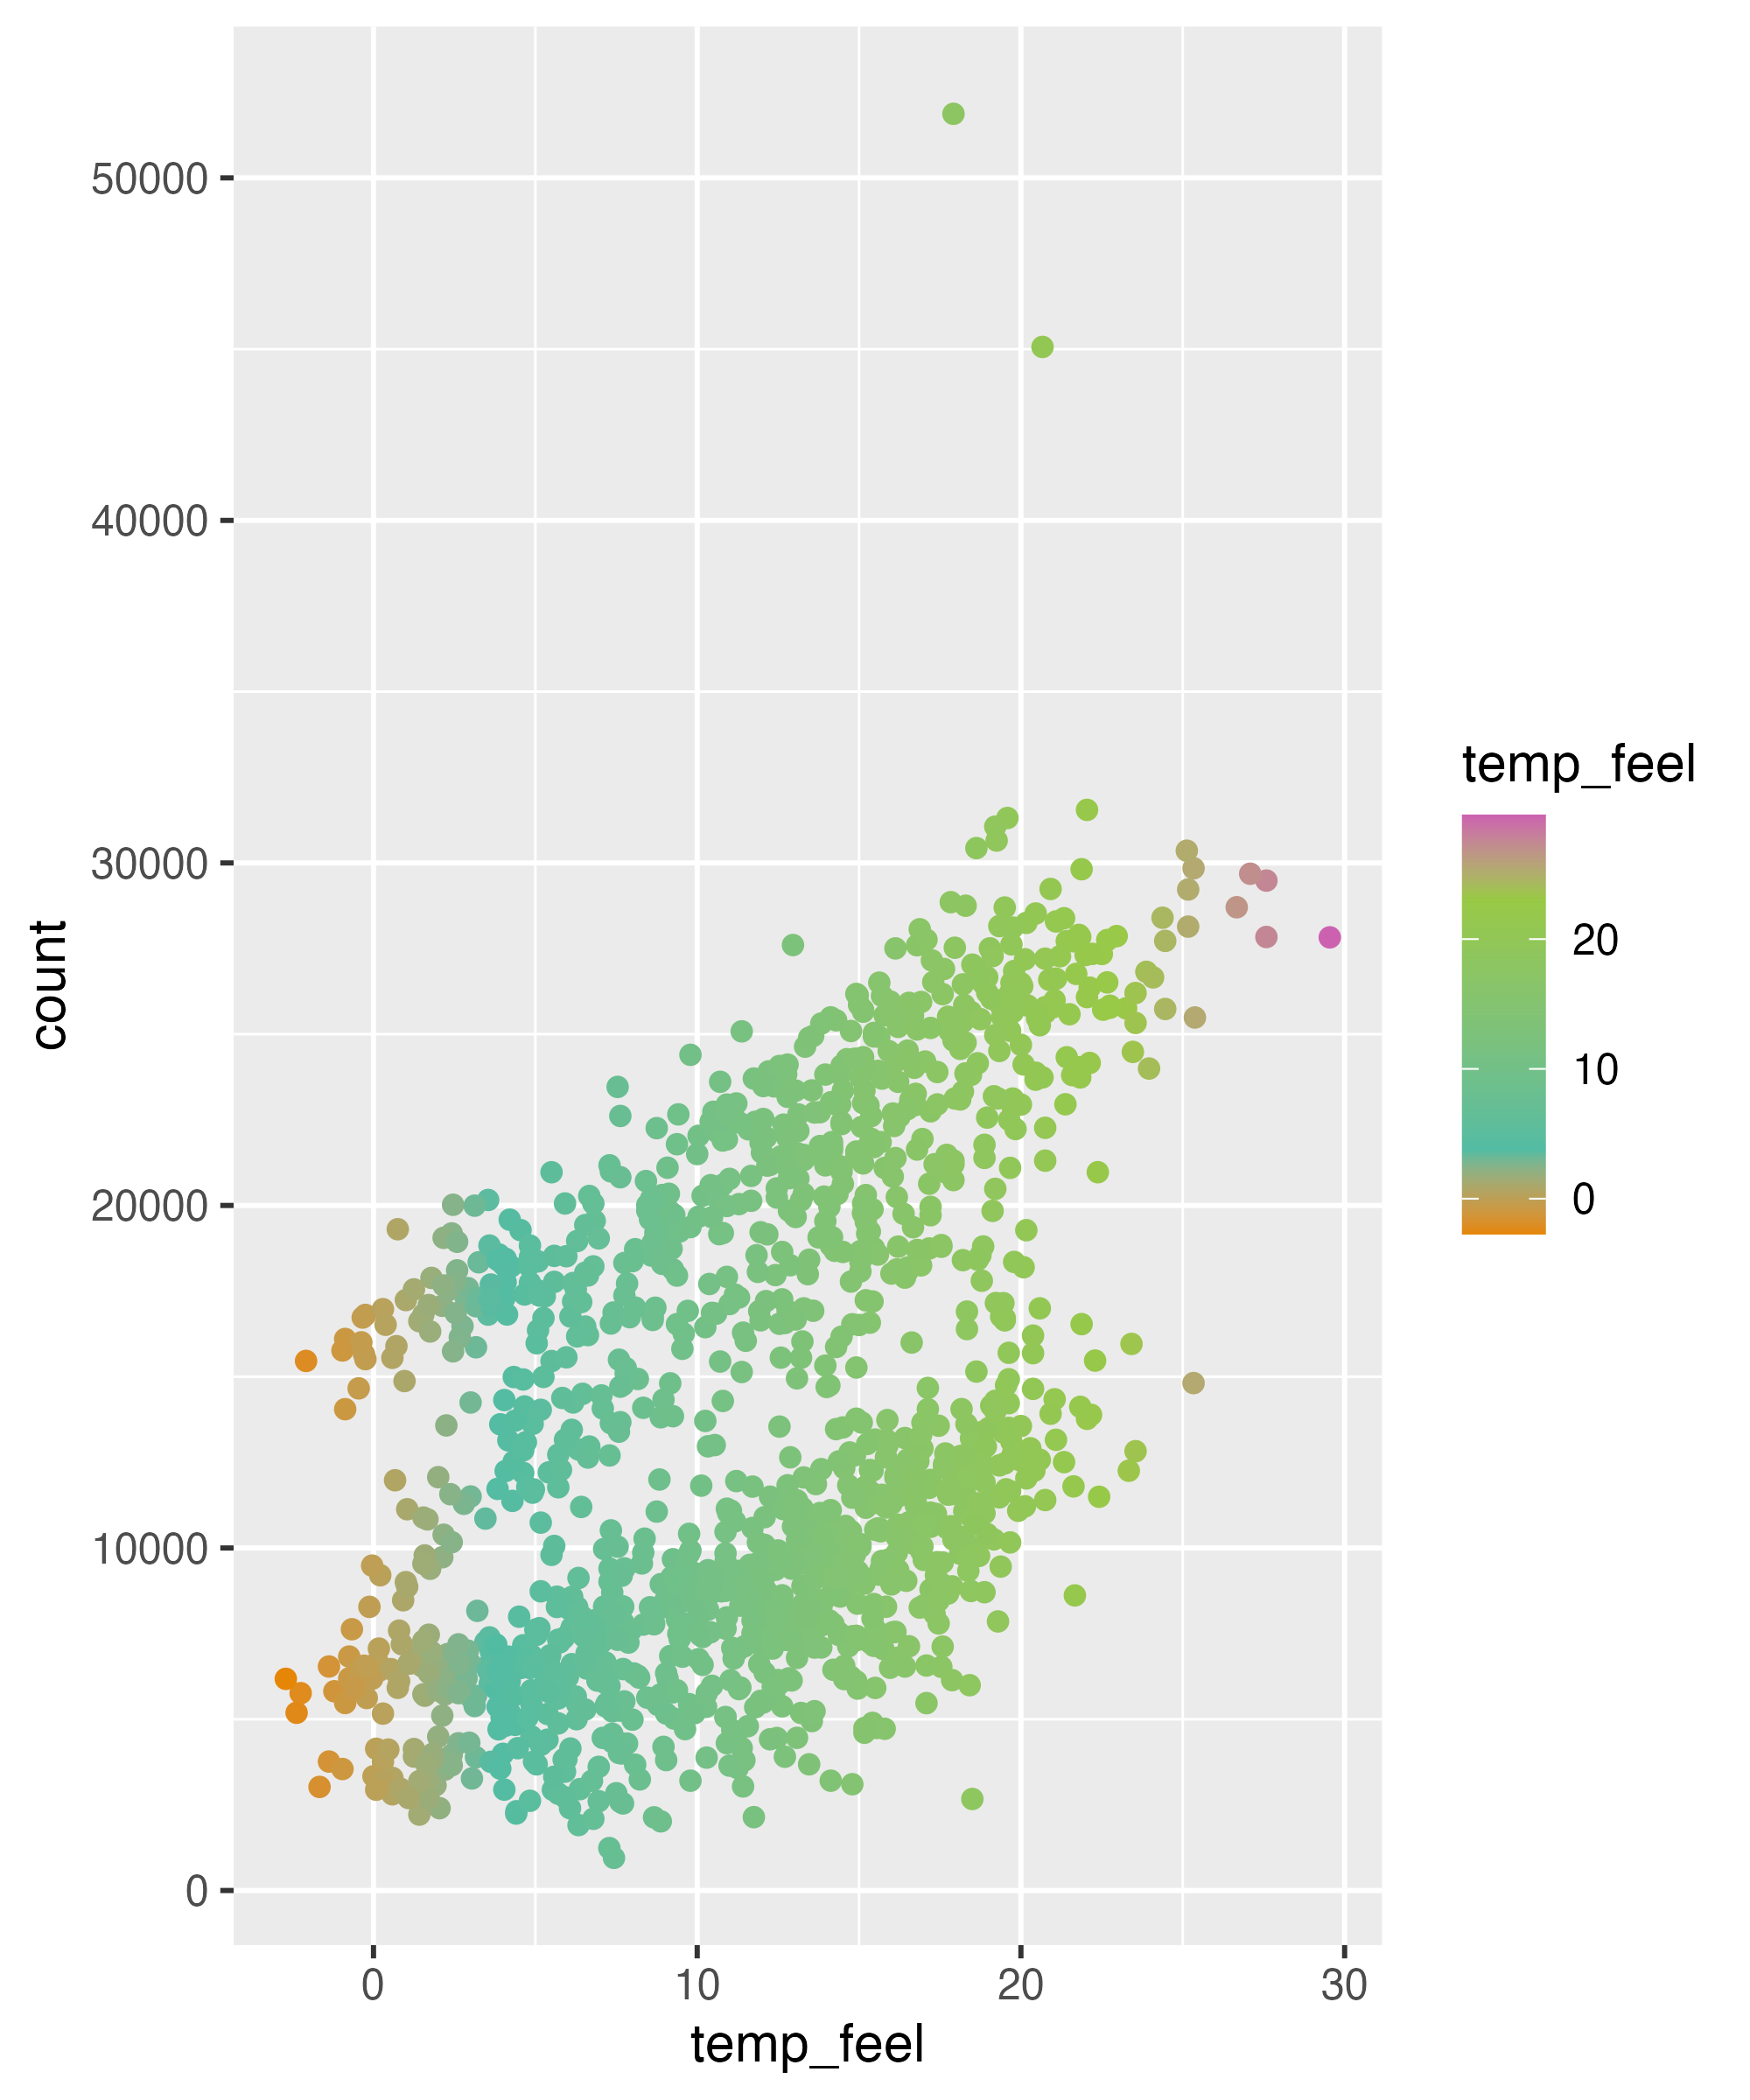

Illustration by W. E. B. Du Bois, Courtesy Library of Congress
Use Your Own scale_fill_*_d()
Use Your Own scale_color_*_d()

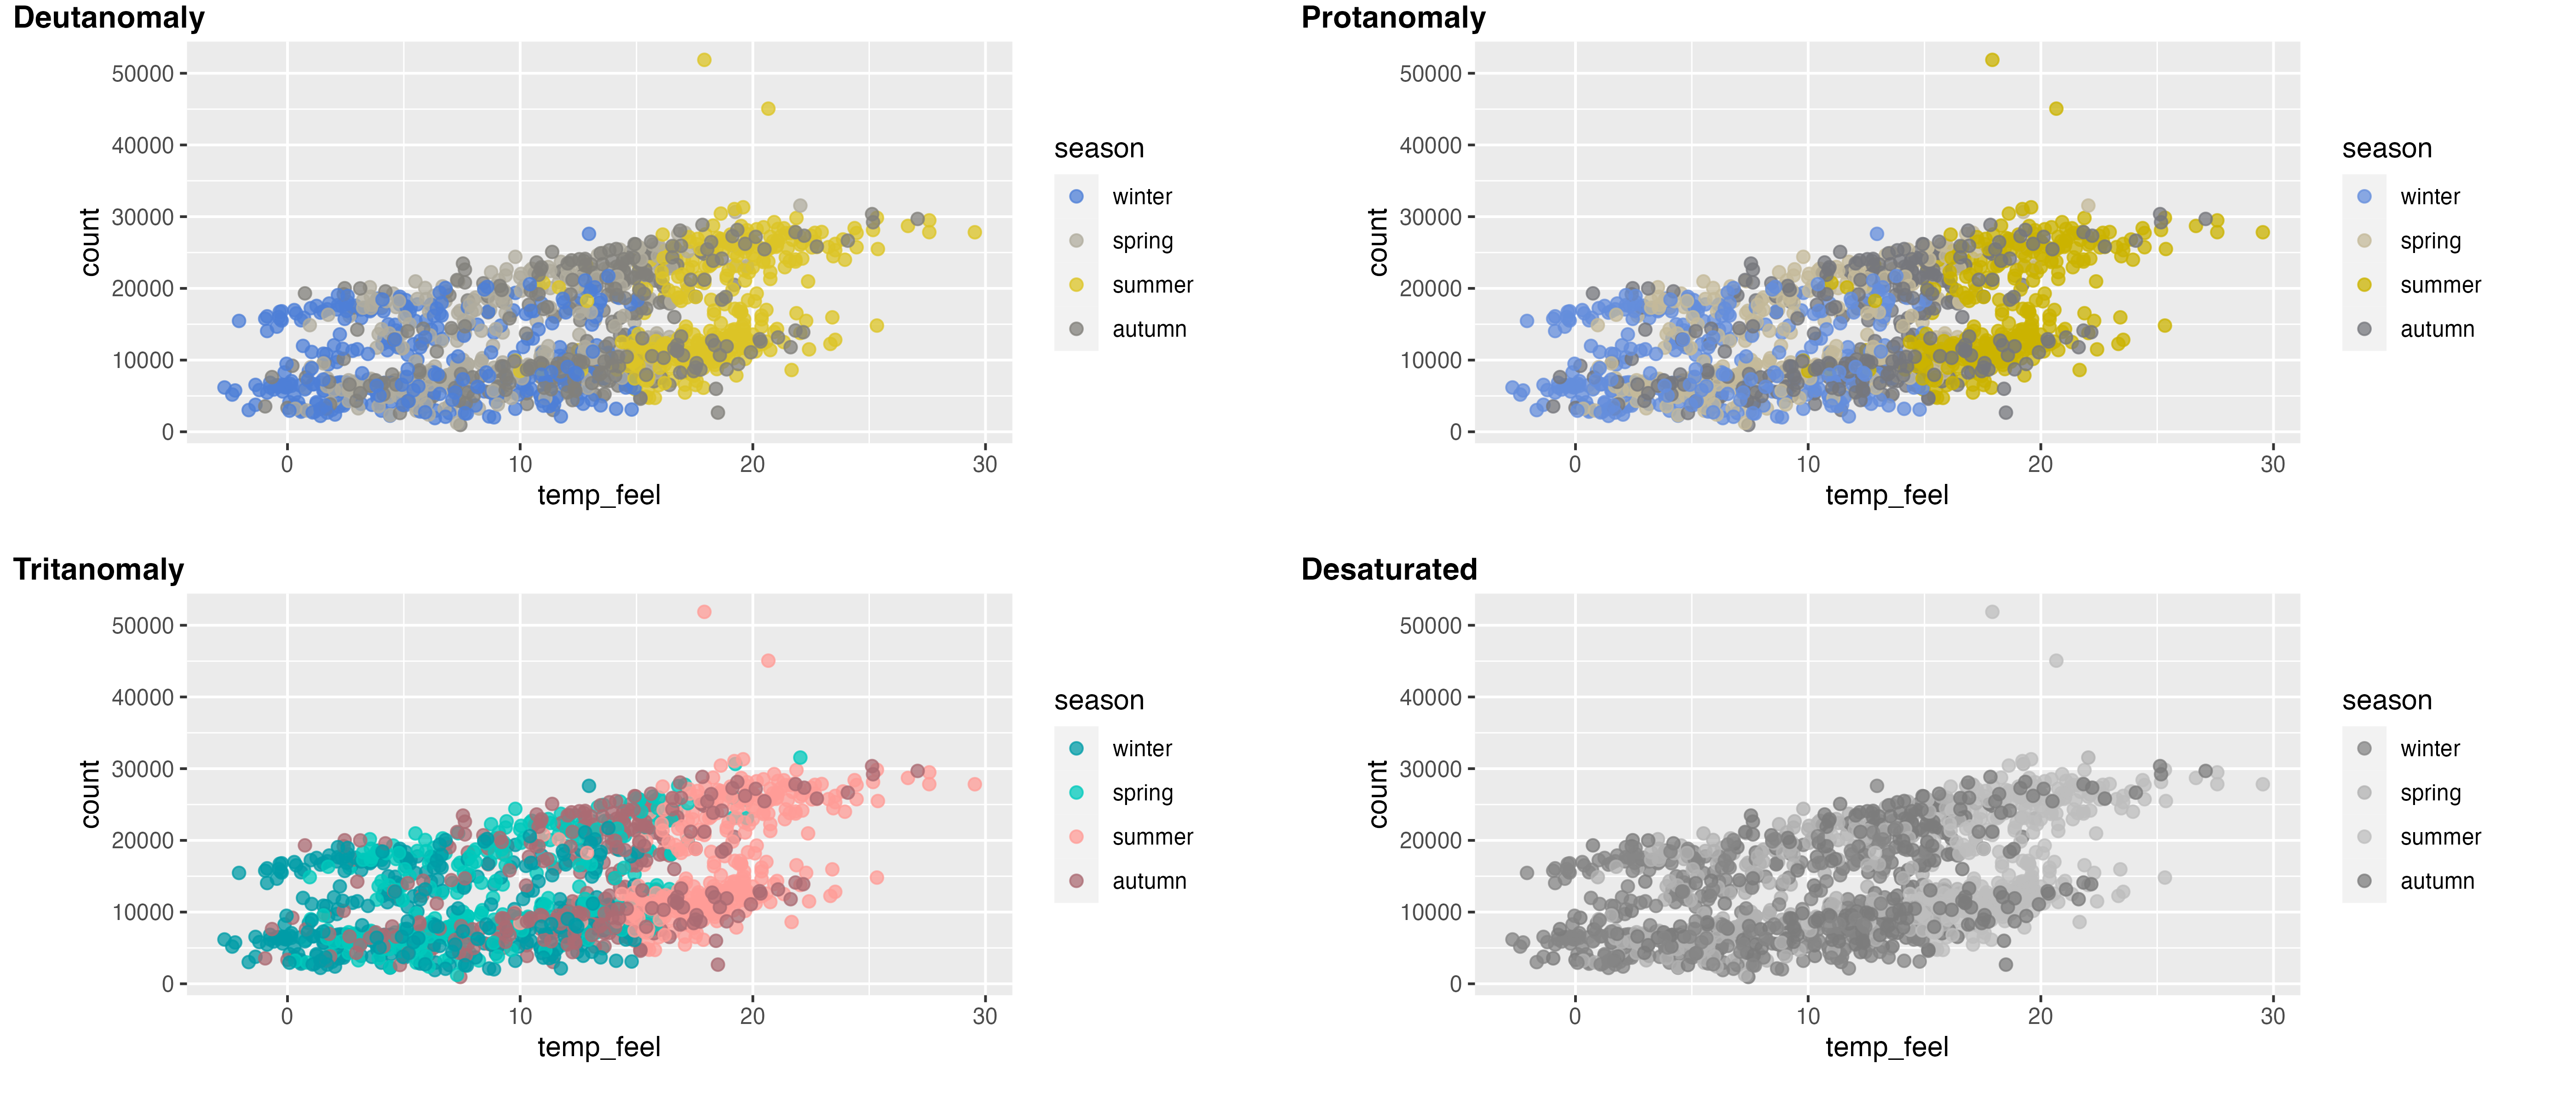
Emulate CVD

Emulate CVD

Emulate CVD
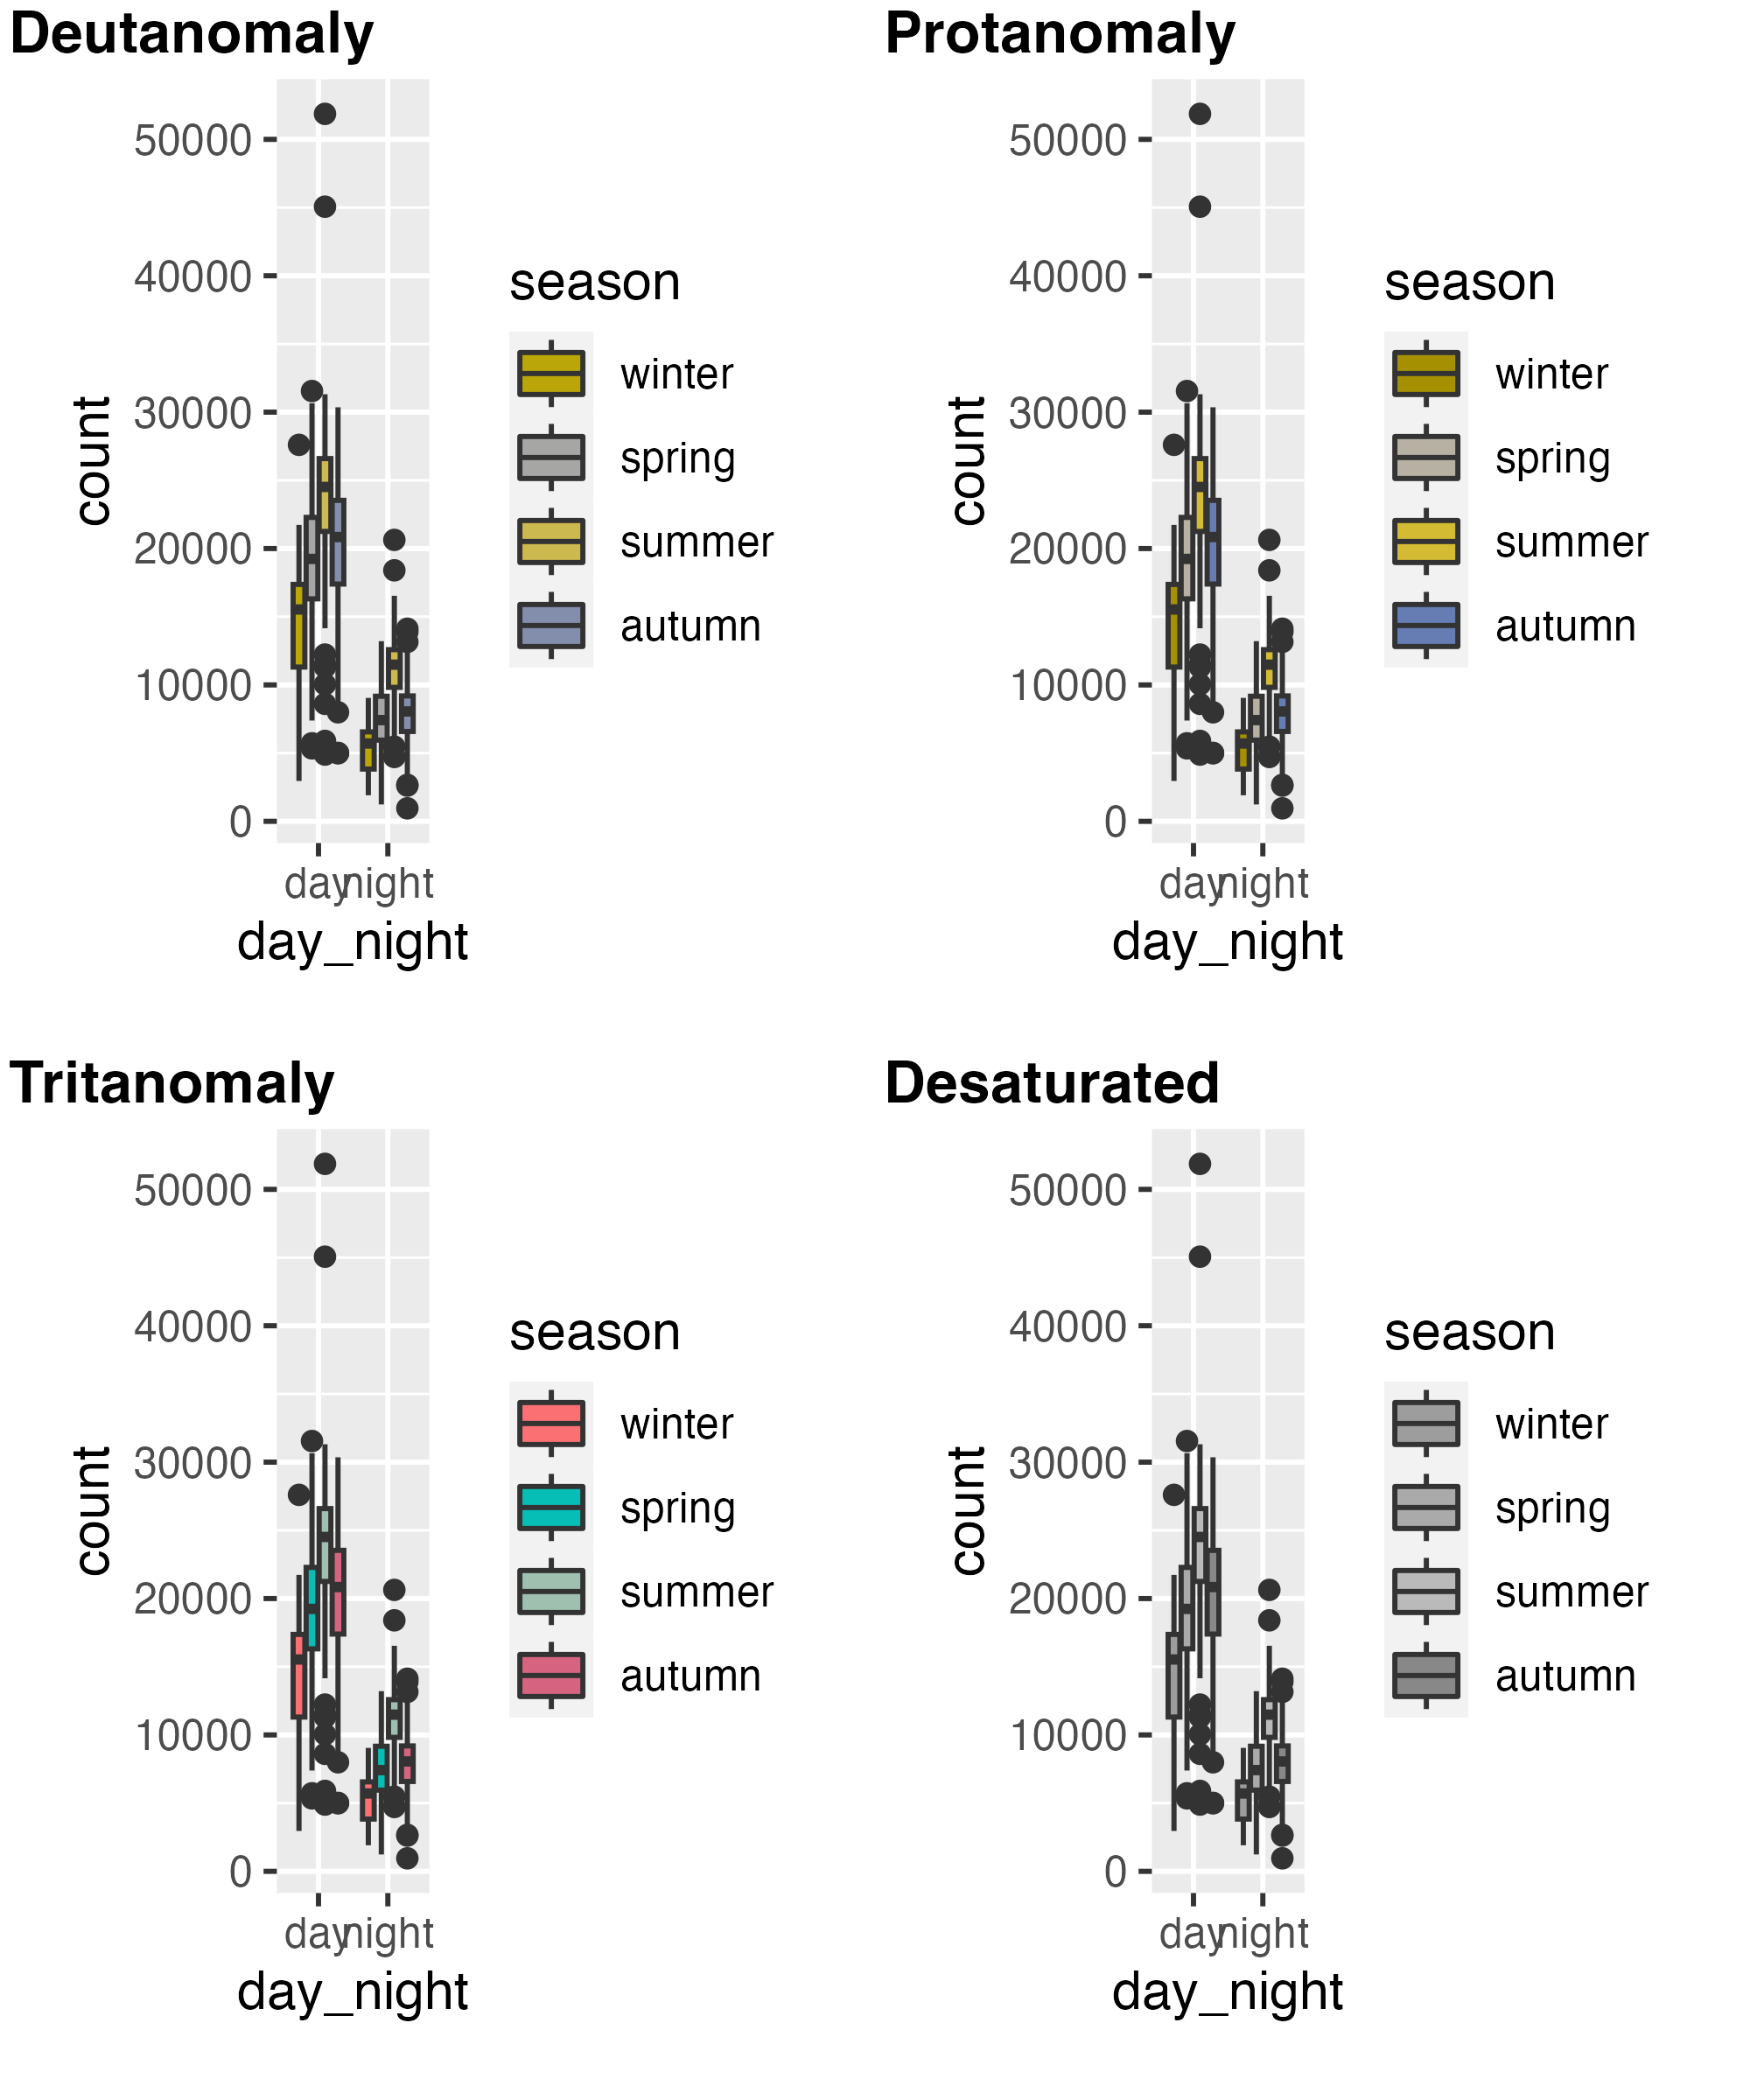
Emulate CVD
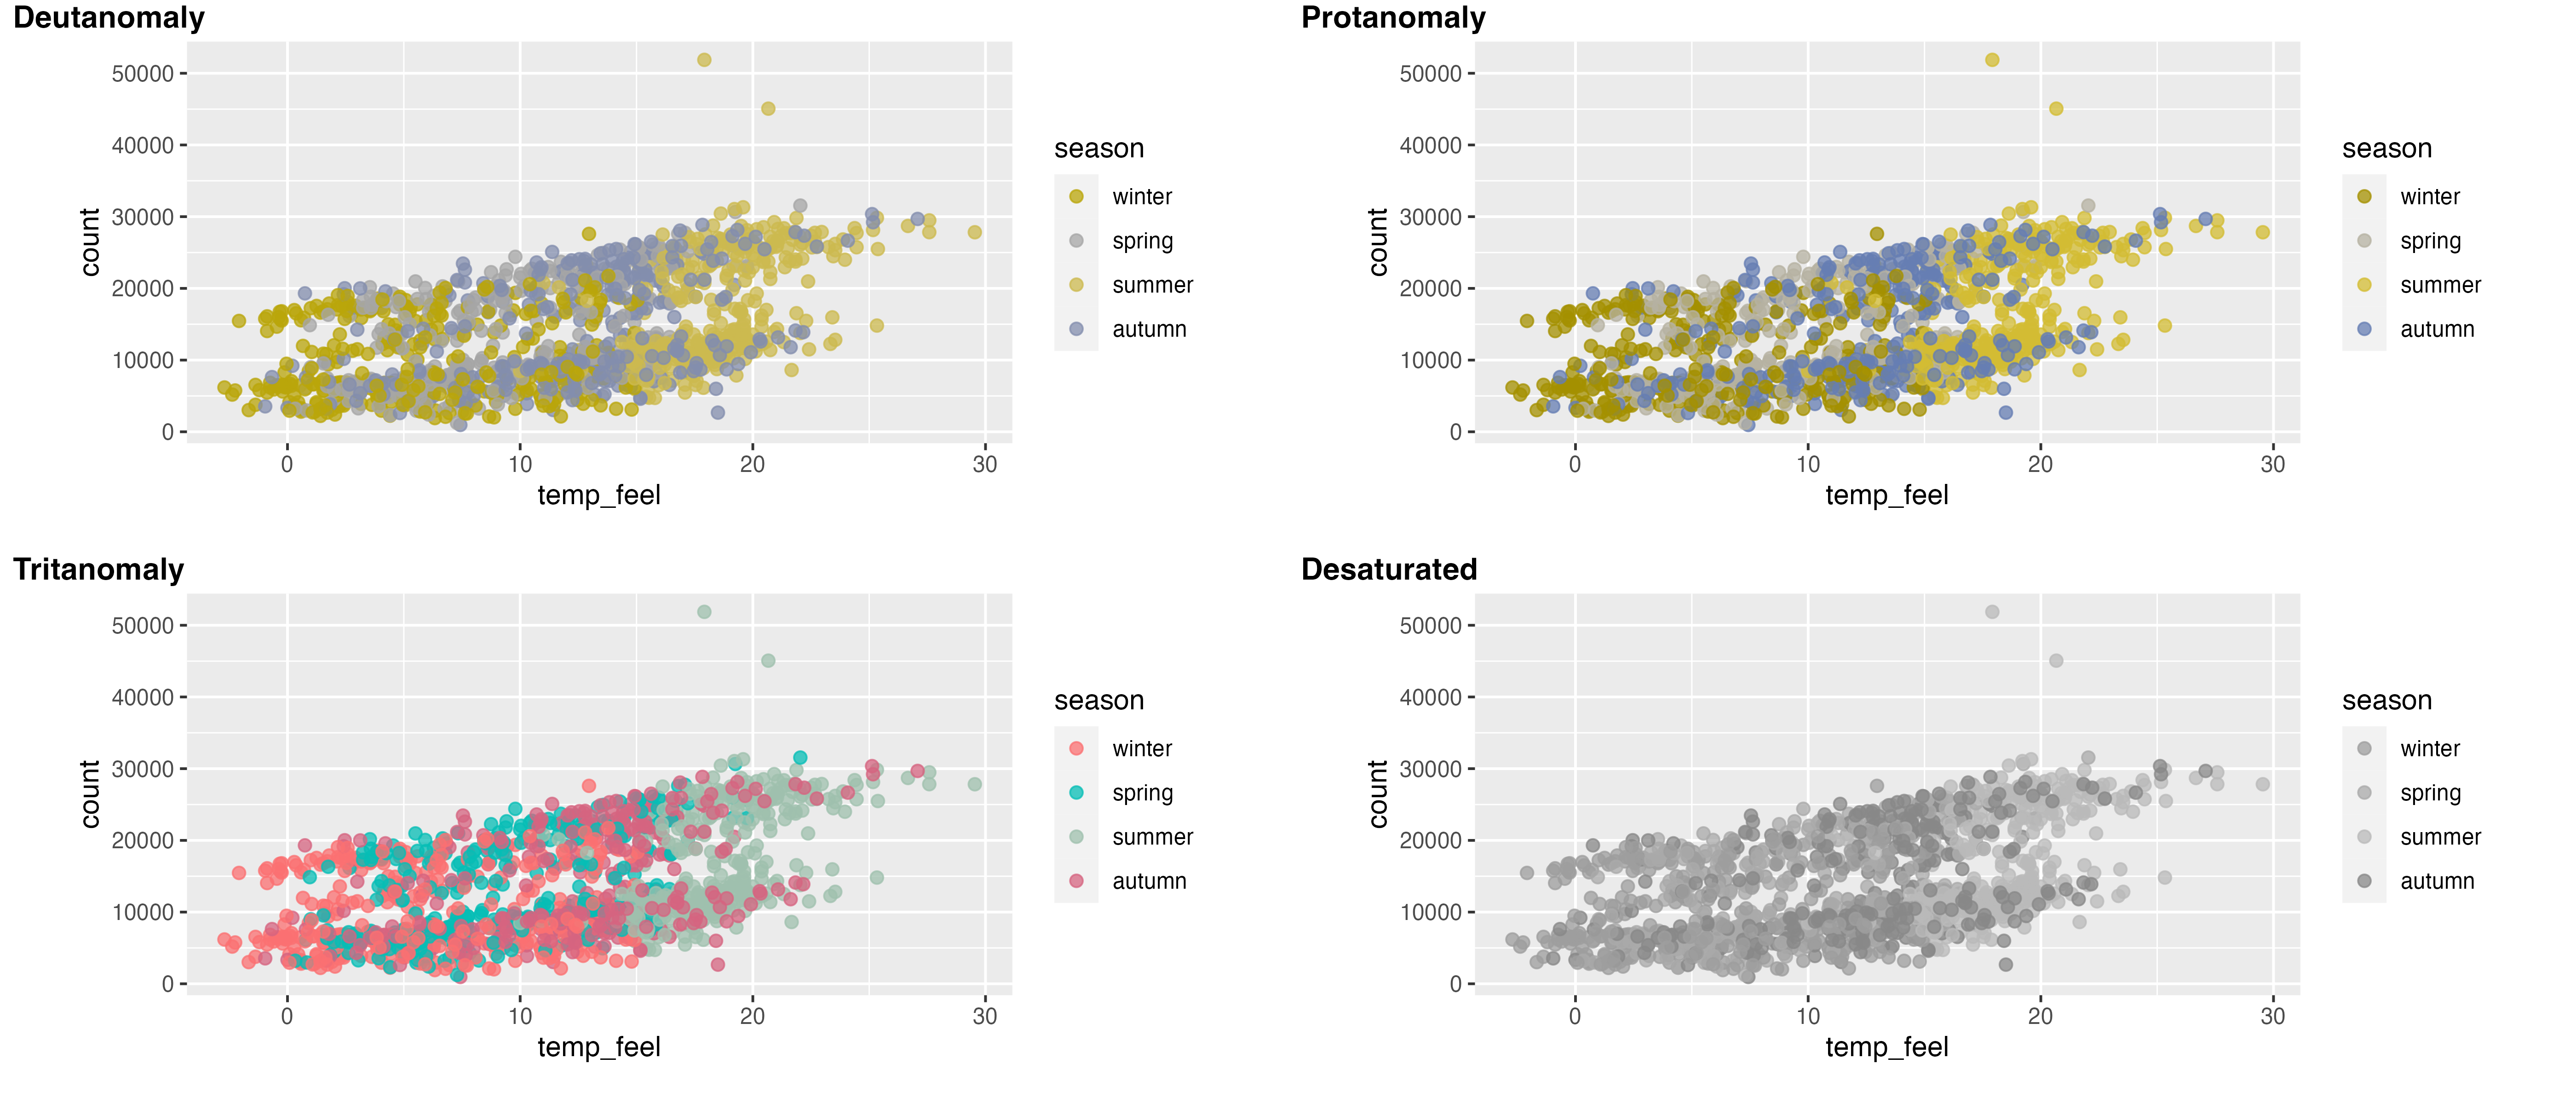
Emulate CVD
Exercise
- Create a similar visualization as close as possible: