05:00
Hello #teachds
rstudio::conf(2022)
Designing the data science classroom
Introductions

Dr. Mine Çetinkaya-Rundel
Dr. Maria Tackett
Workshop materials
One link for all materials
Asking for help (Stickies)
I’m stuck
I’m done

I have a general question
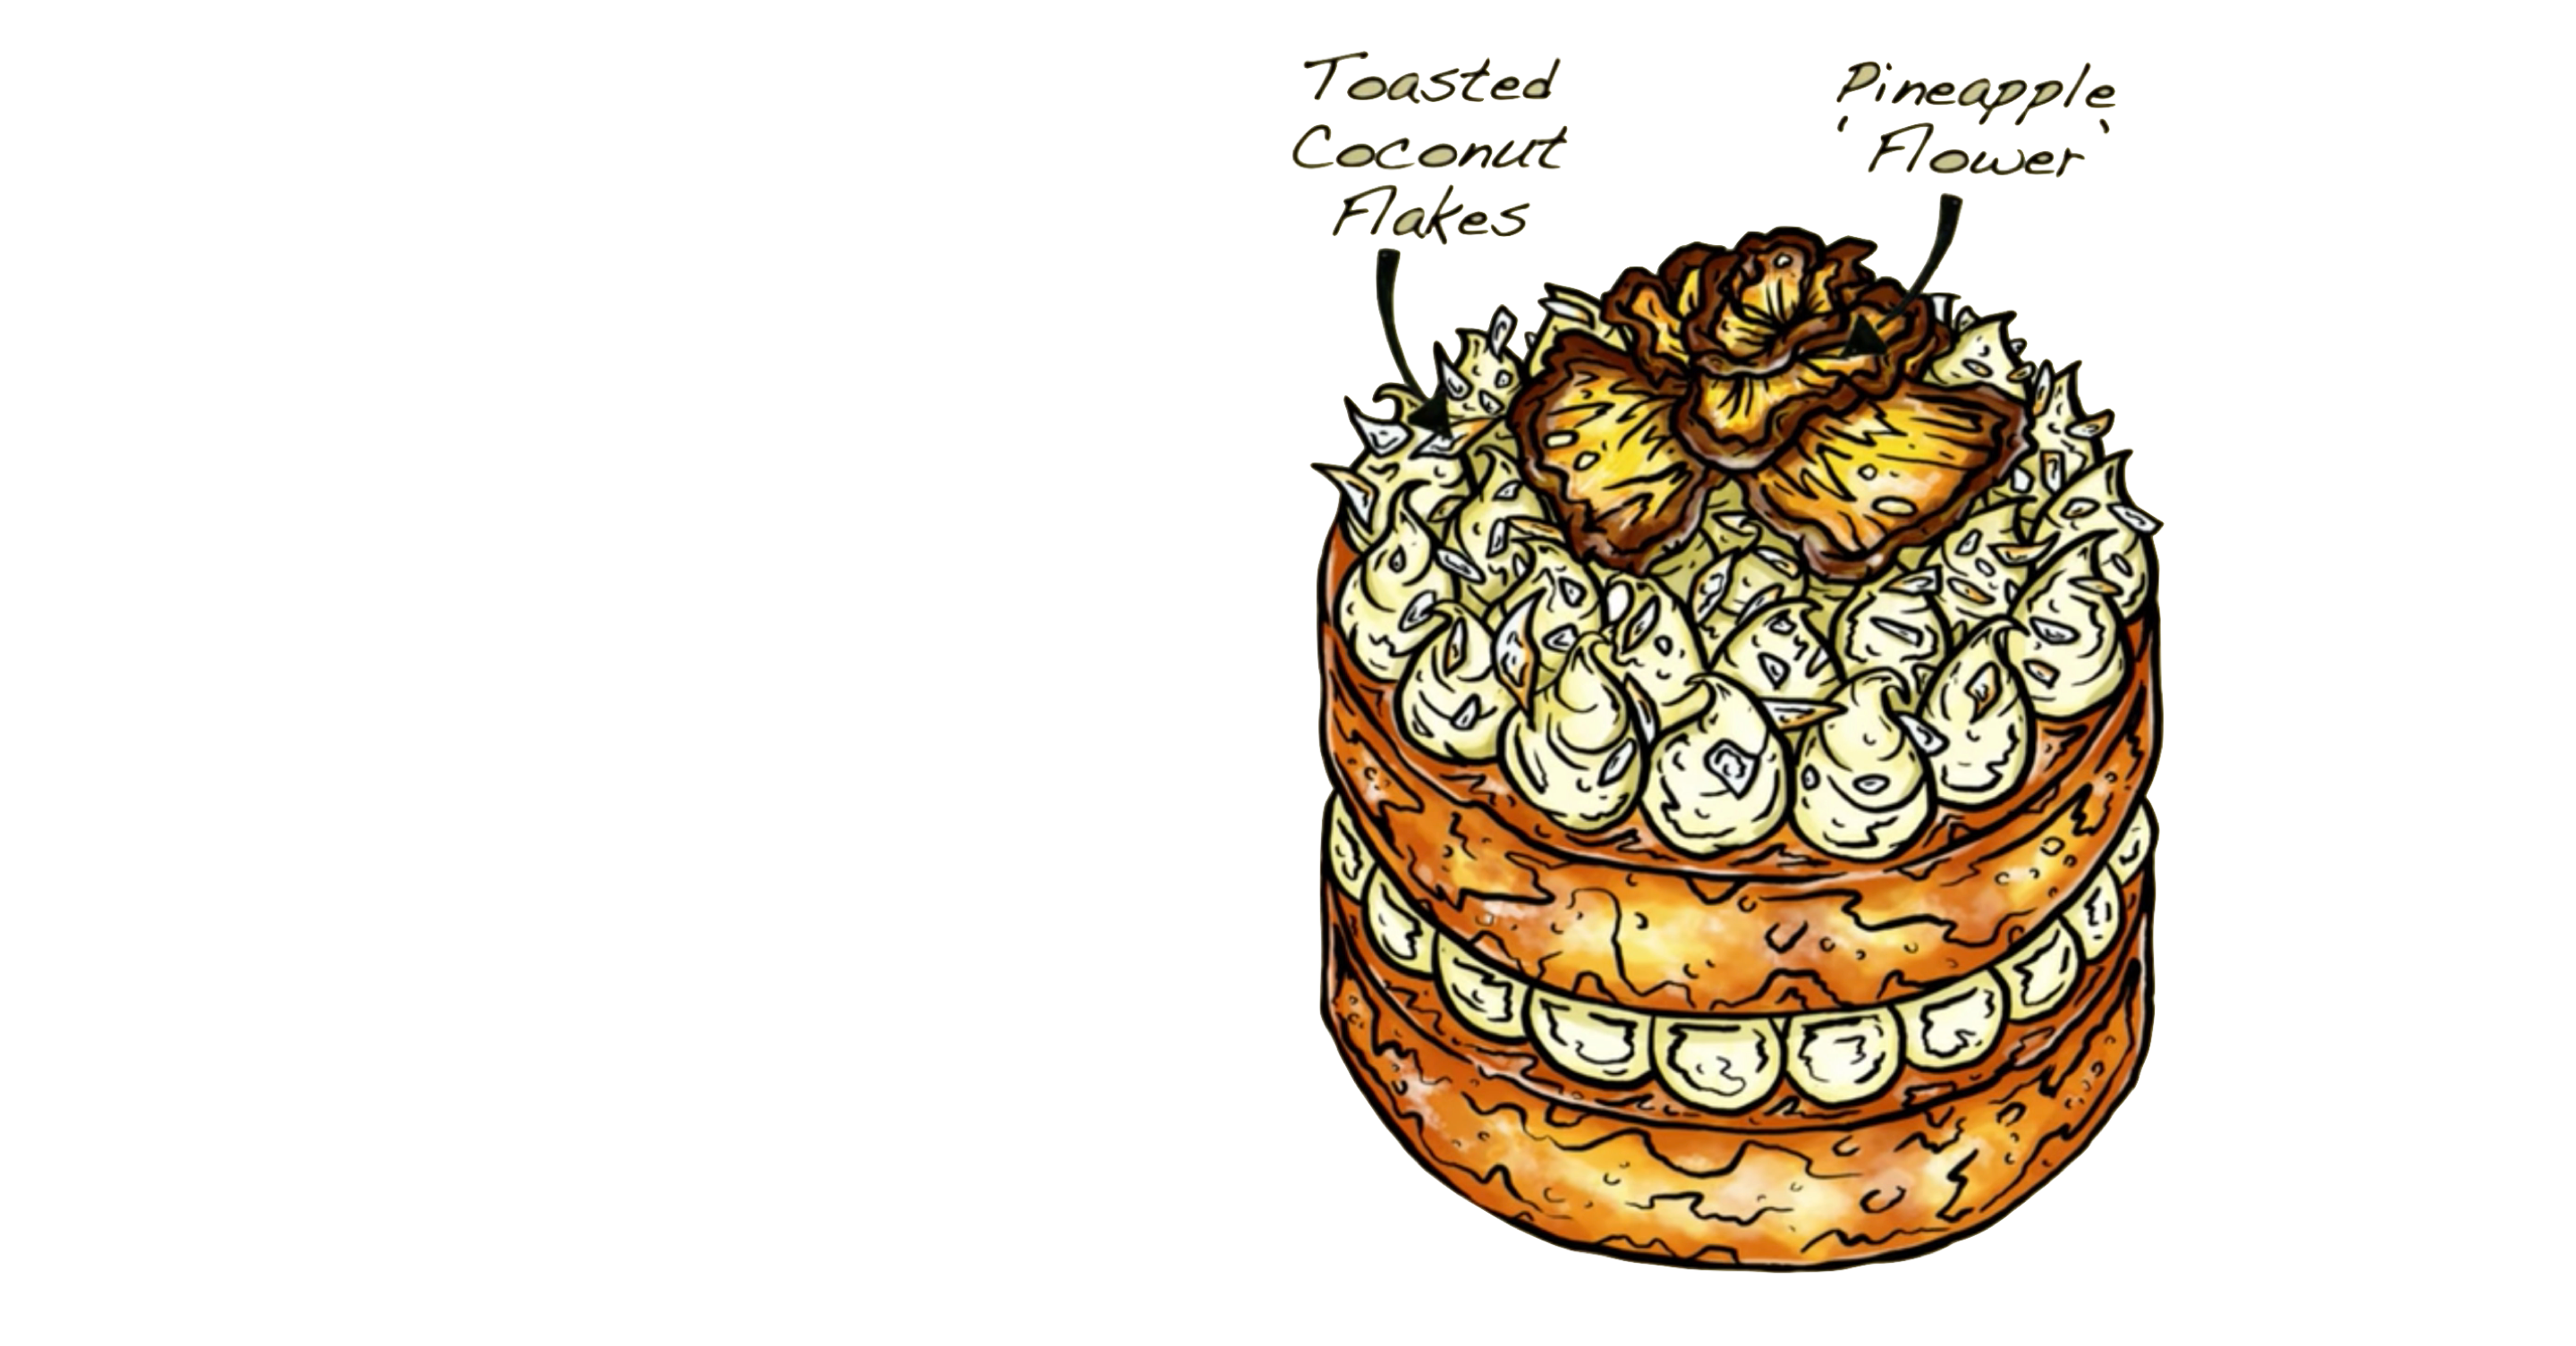
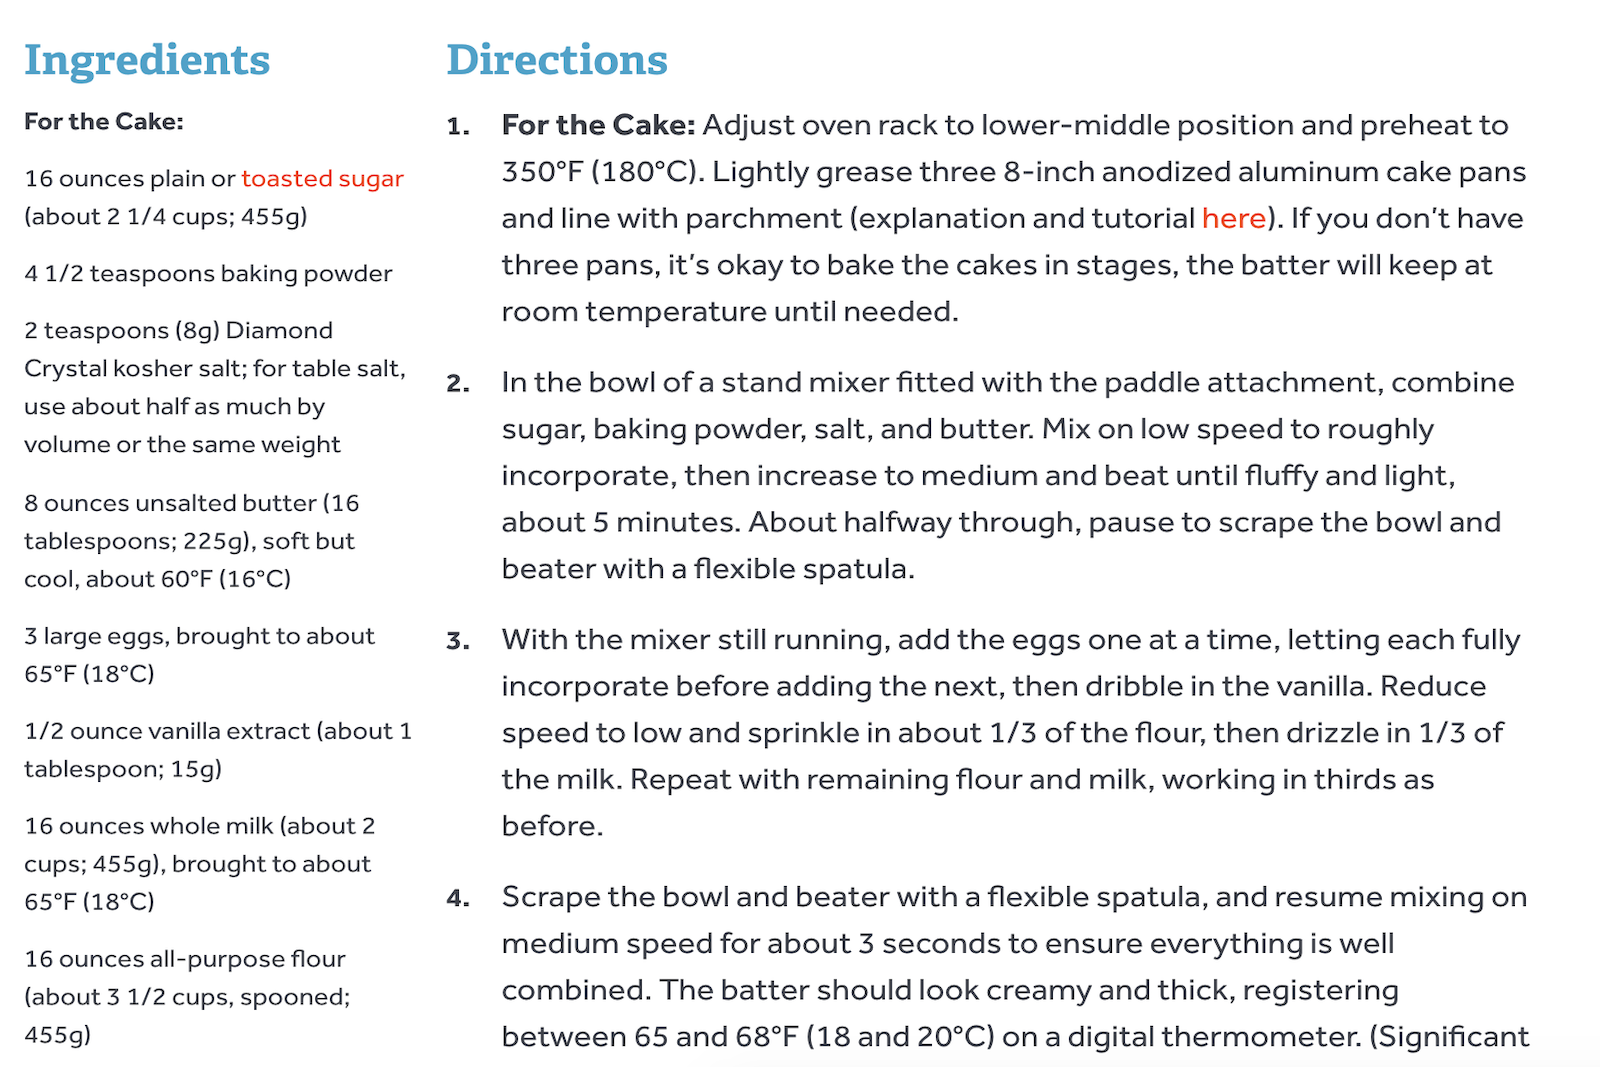
Baking a cake
Today we’re going to make a pineapple and coconut sandwich sponge cake with these ingredients
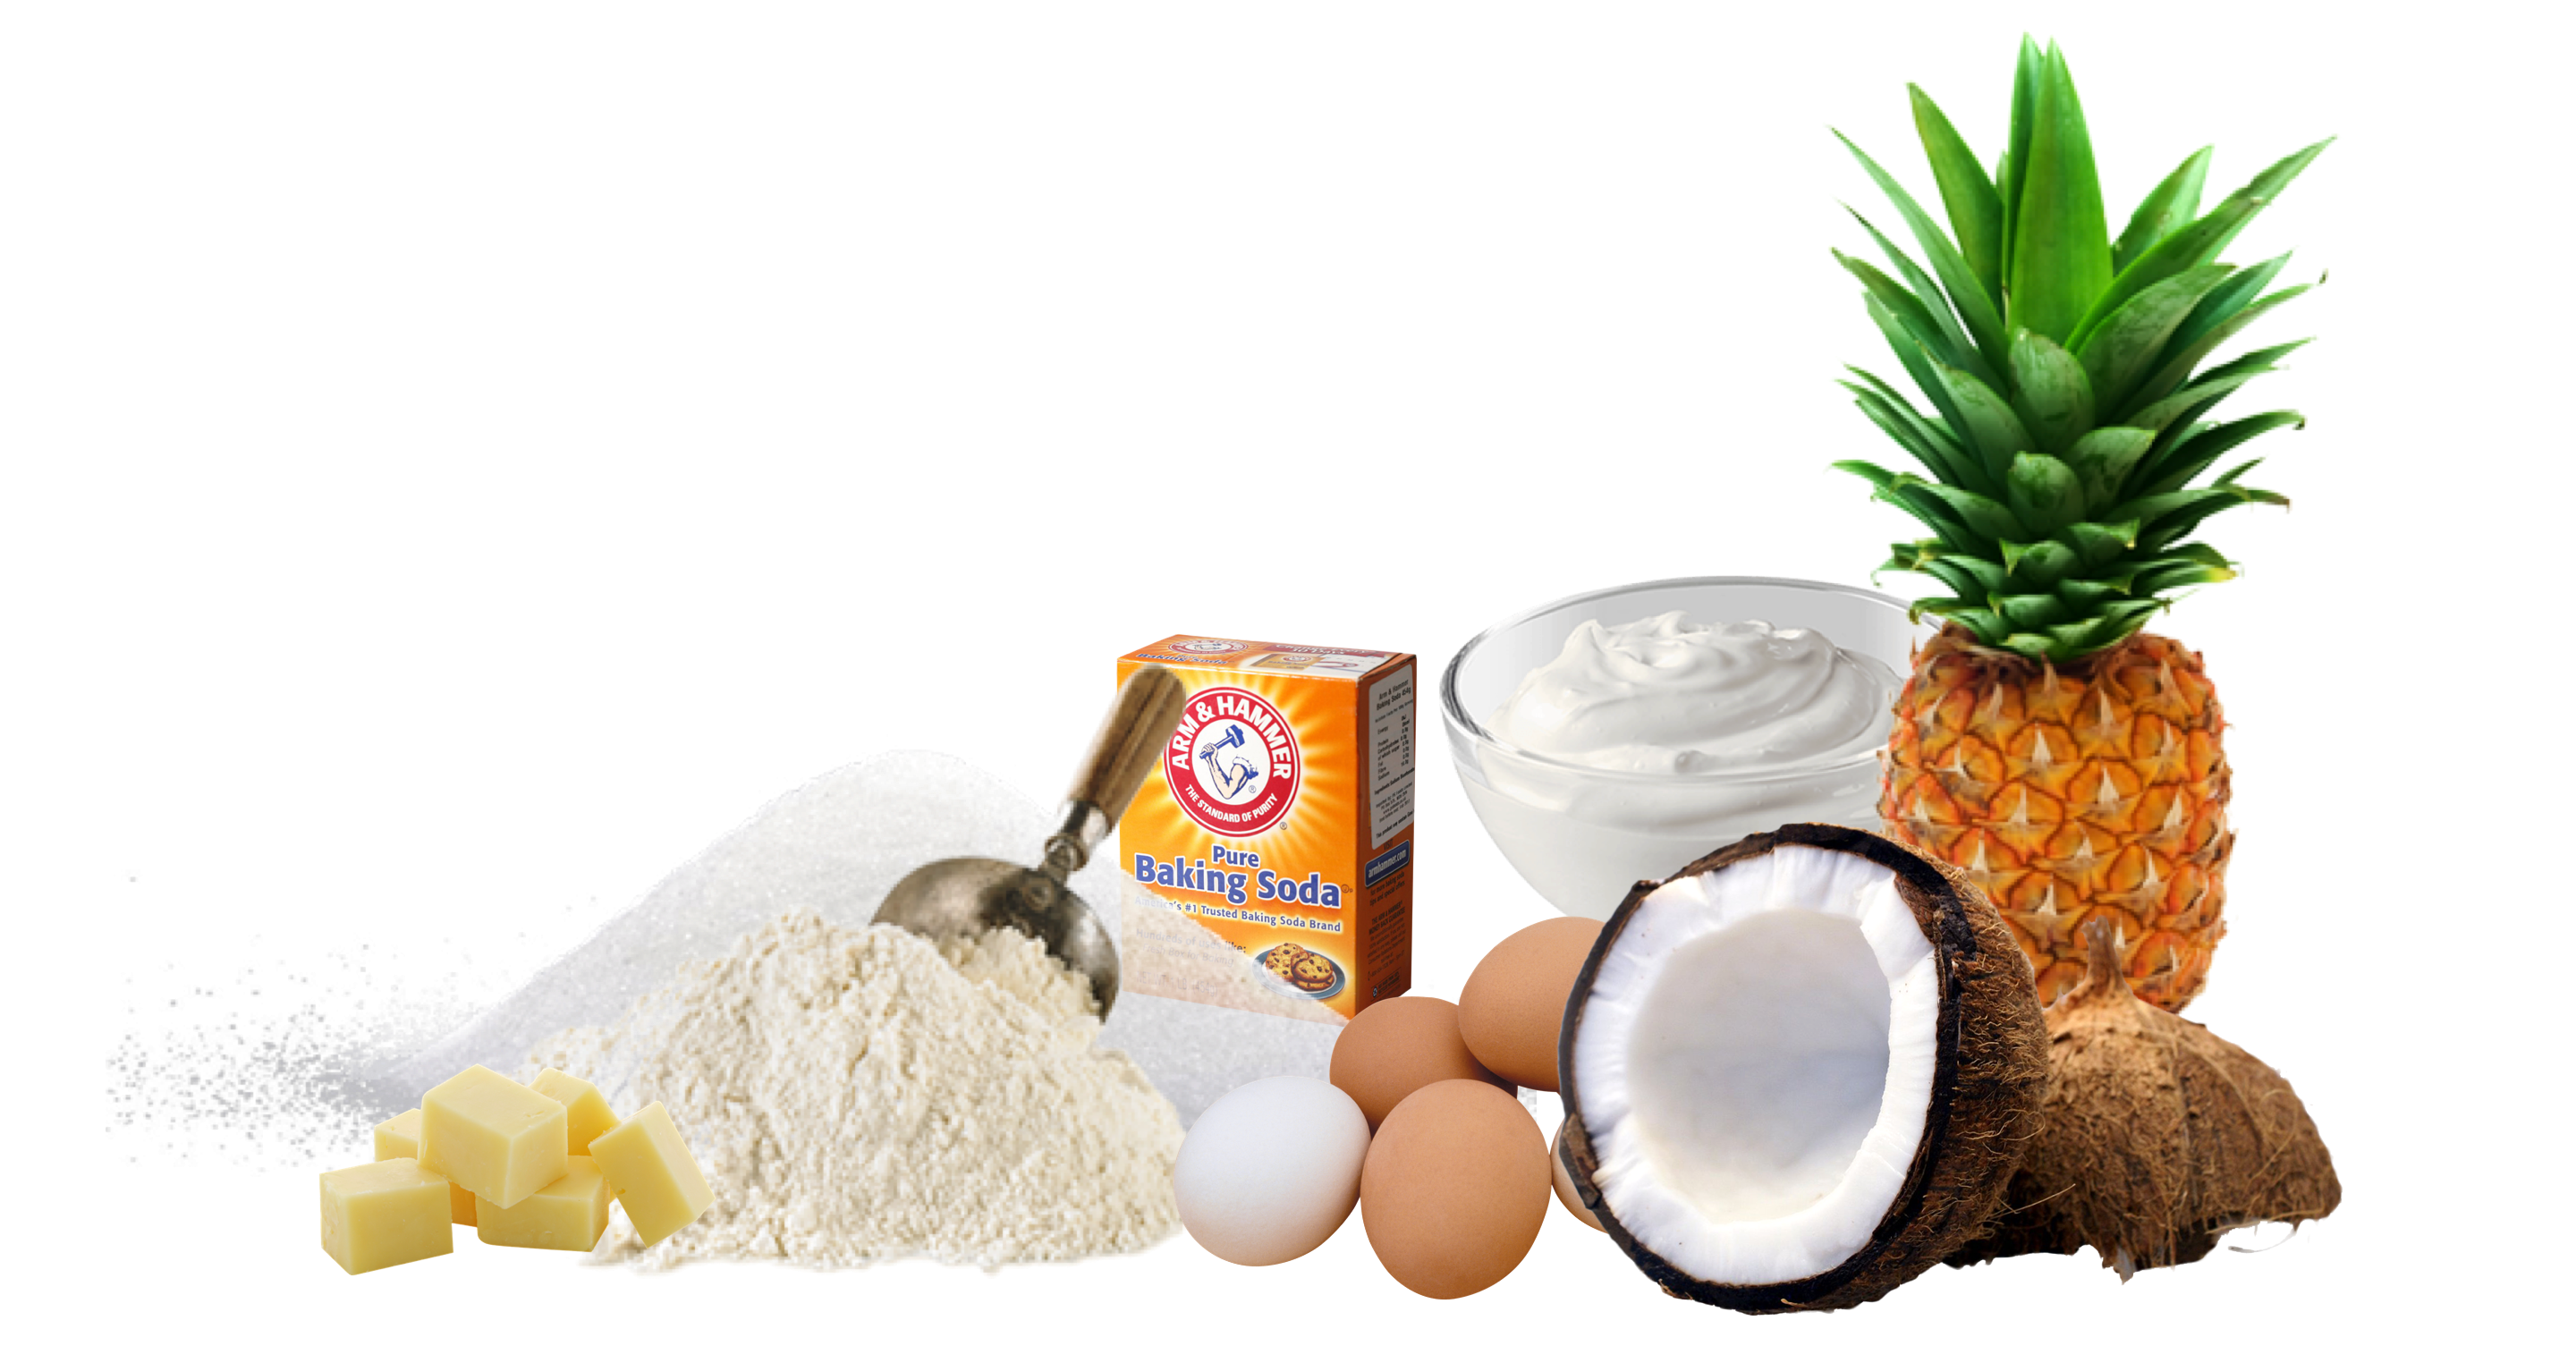
Baking a cake
Today we’re going to make a pineapple and coconut sandwich sponge cake with these ingredients
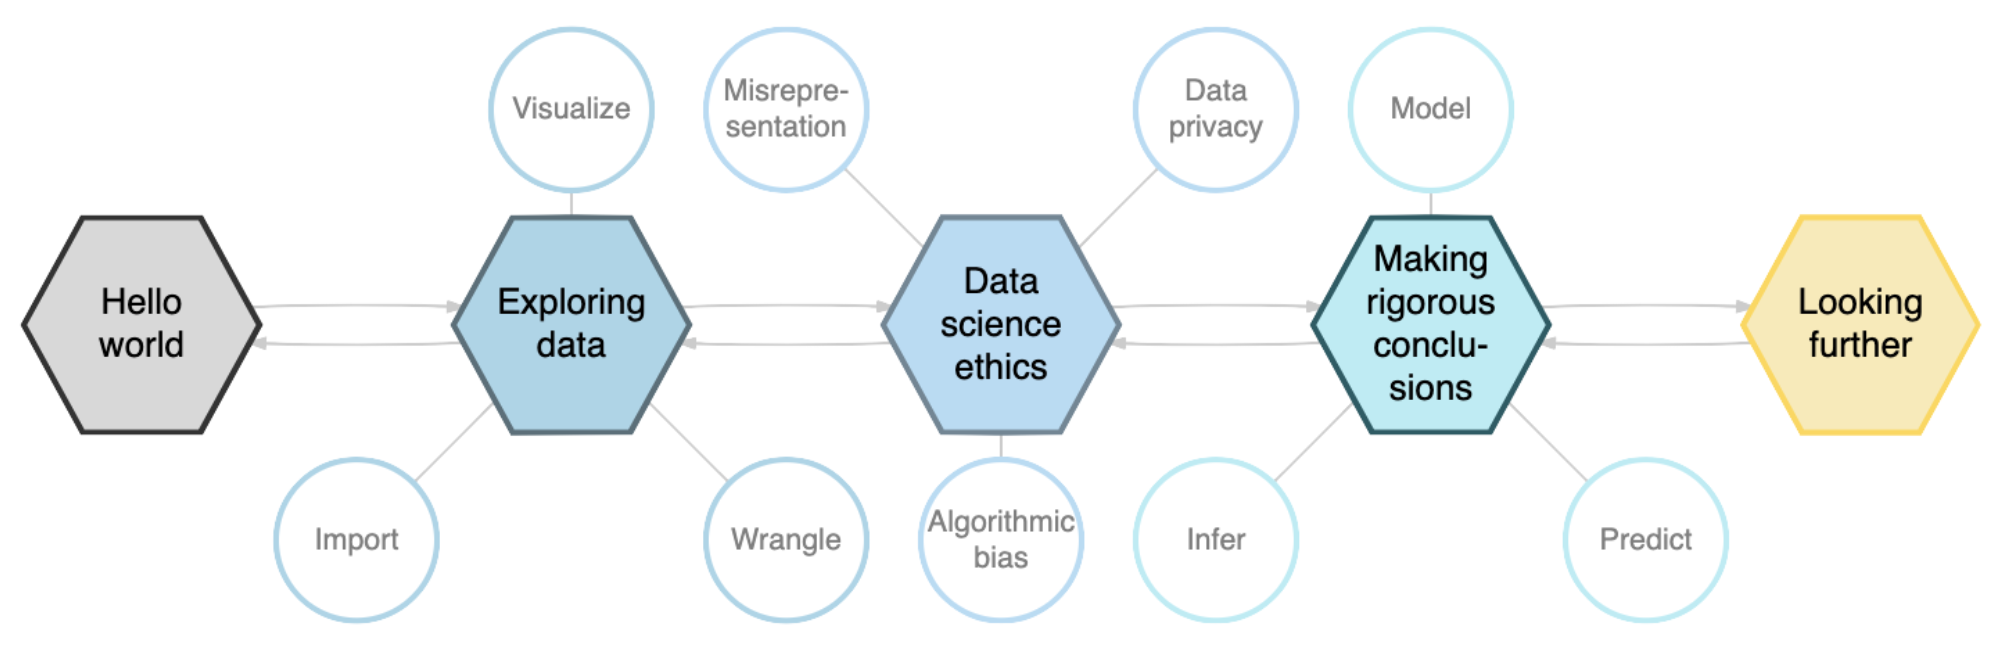
So, where do we go with all this?
Which kitchen would you rather bake in?


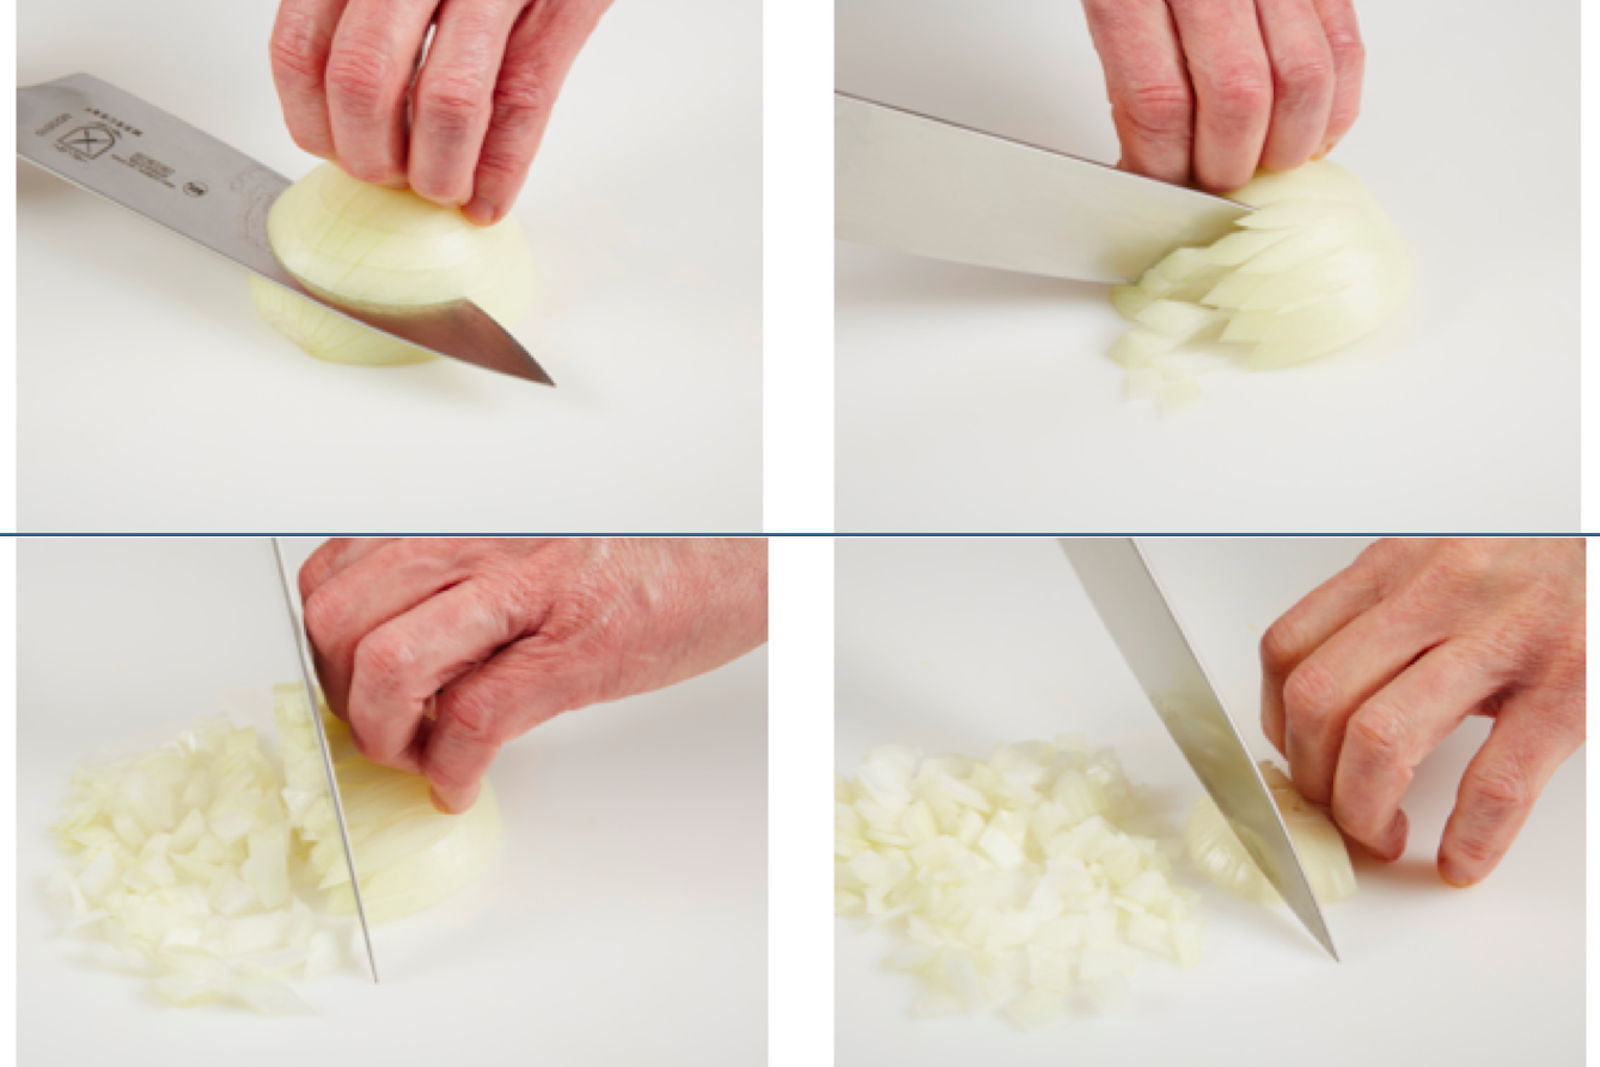
How do you prefer your cake recipes? Words only, or words & pictures?

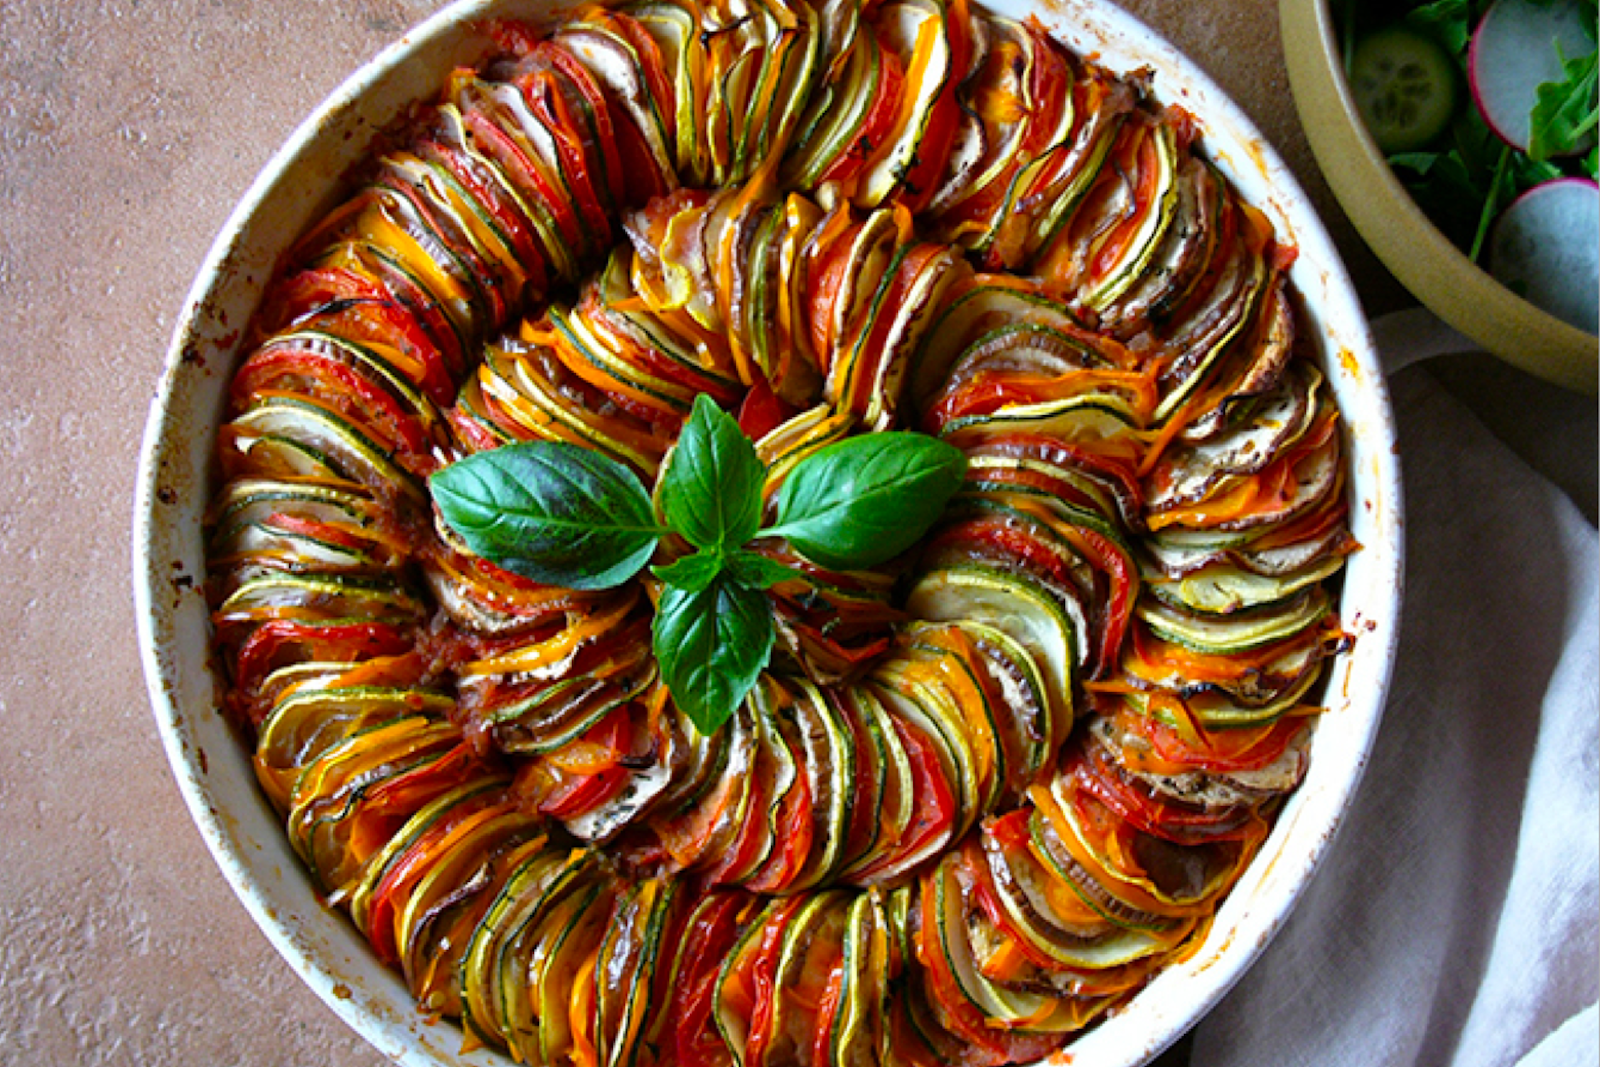
Which motivates you more to learn how to cook: perfectly chopped onions or ratatouille?
Design principle 3: Skip baby steps
Practically speaking…
- Non-trivial examples can be motivating, but need to avoid…
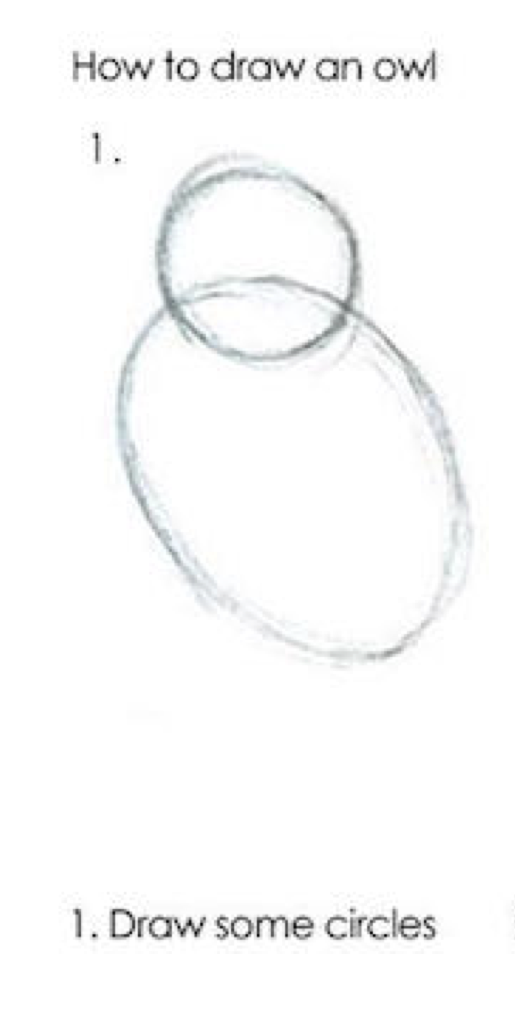
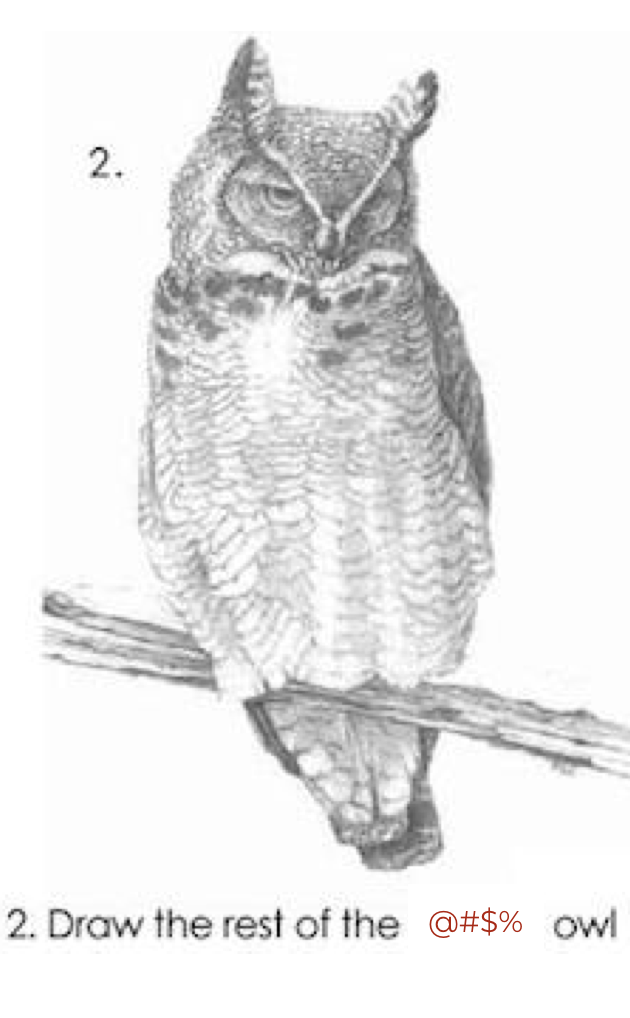
- Scaffold and layer in between!
Scaffold 1

Scaffold 2
Scaffold 3
Scaffold 4
Scaffold 5
Scaffold 6
Skip Re-insert baby steps
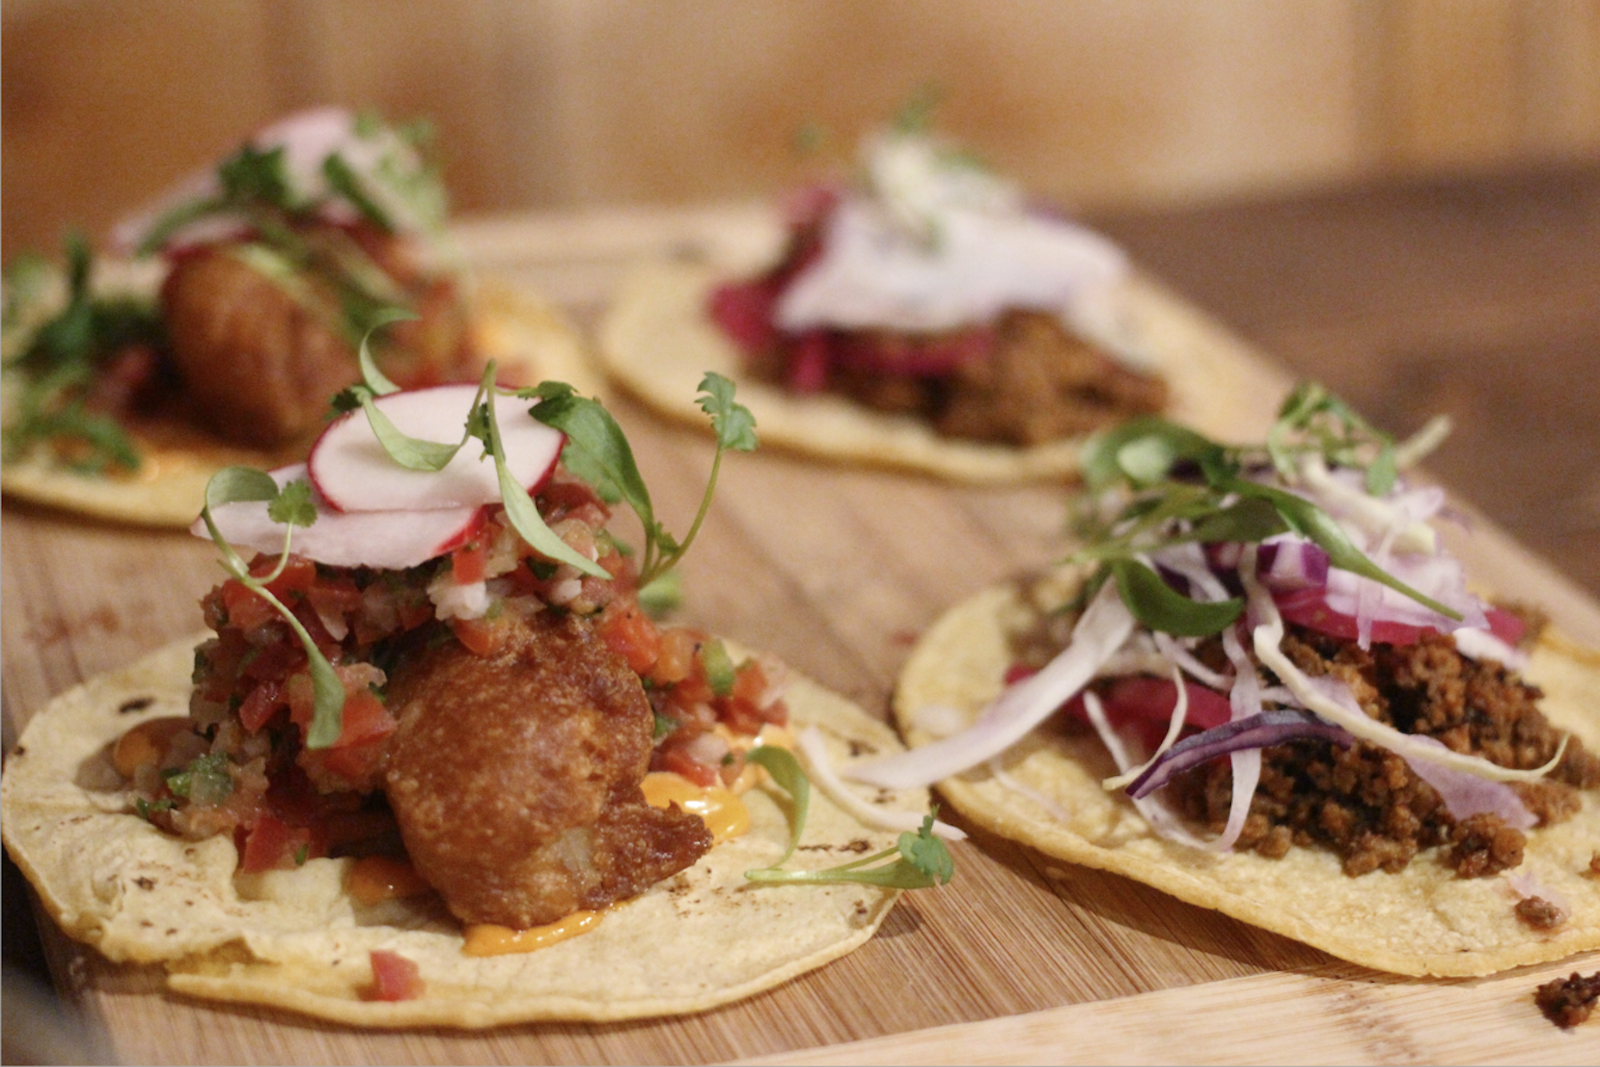
Which is more likely to appeal to someone who has never tried broccoli?
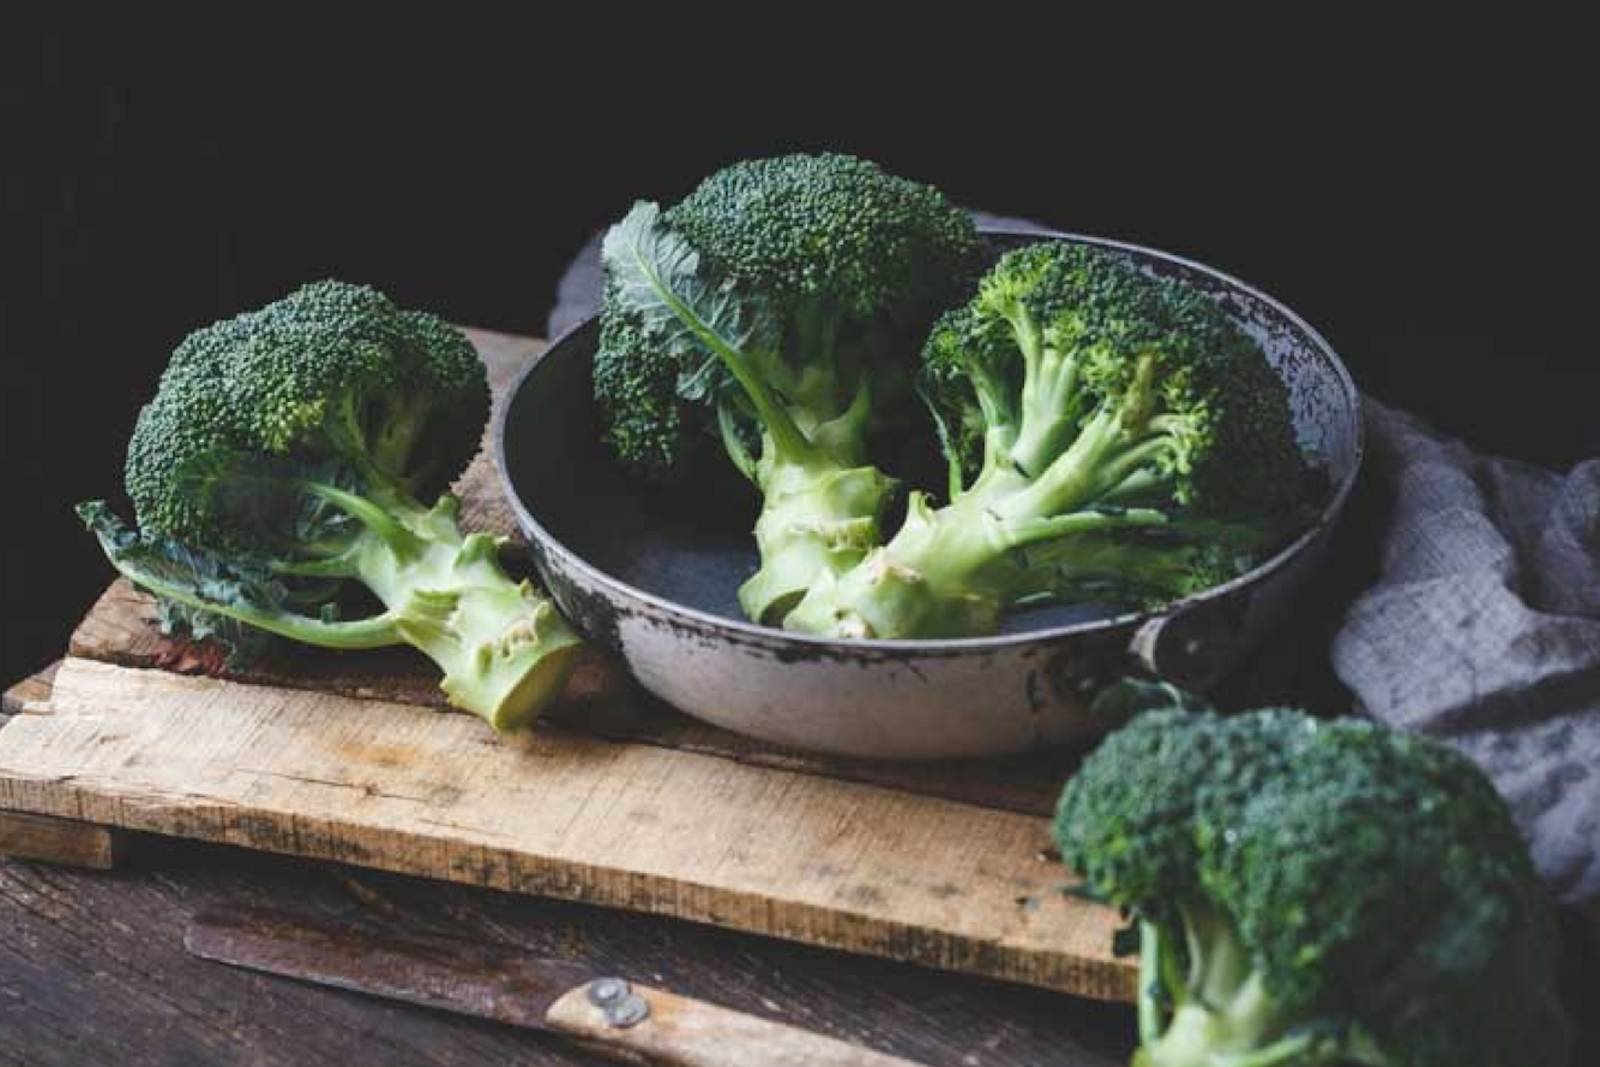

Design principle 4: Hide the veggies
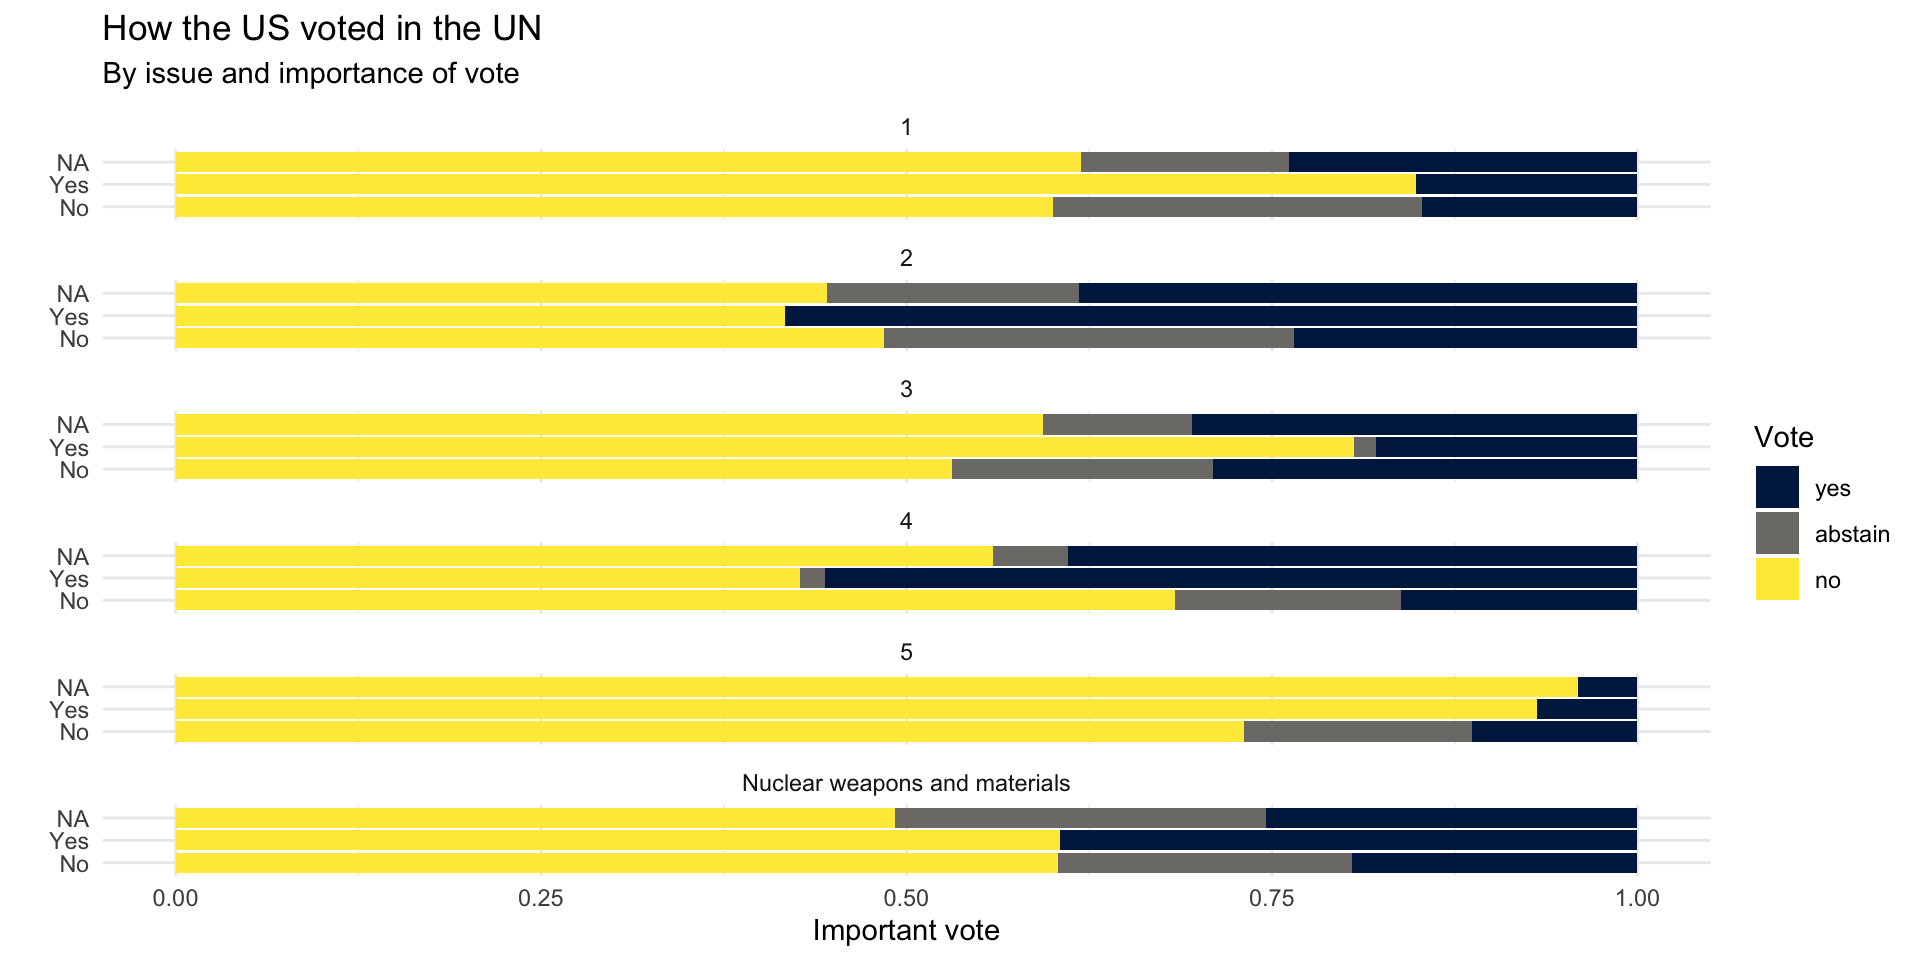
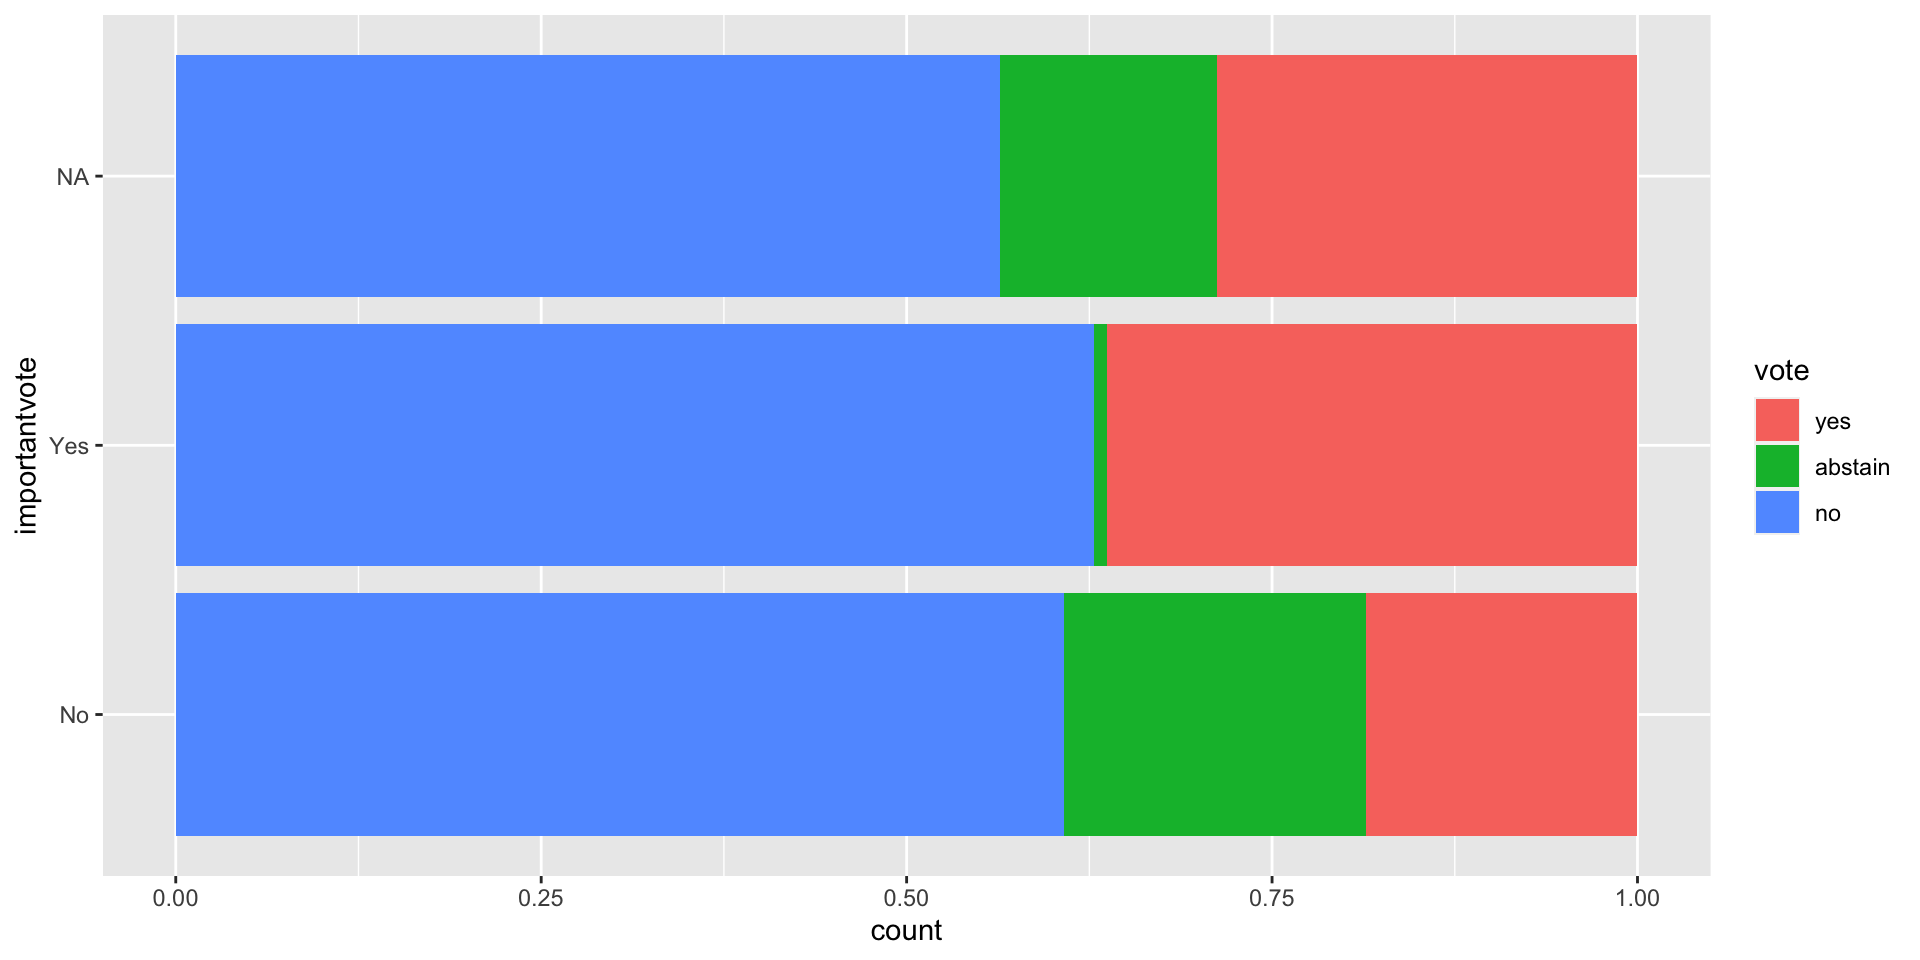
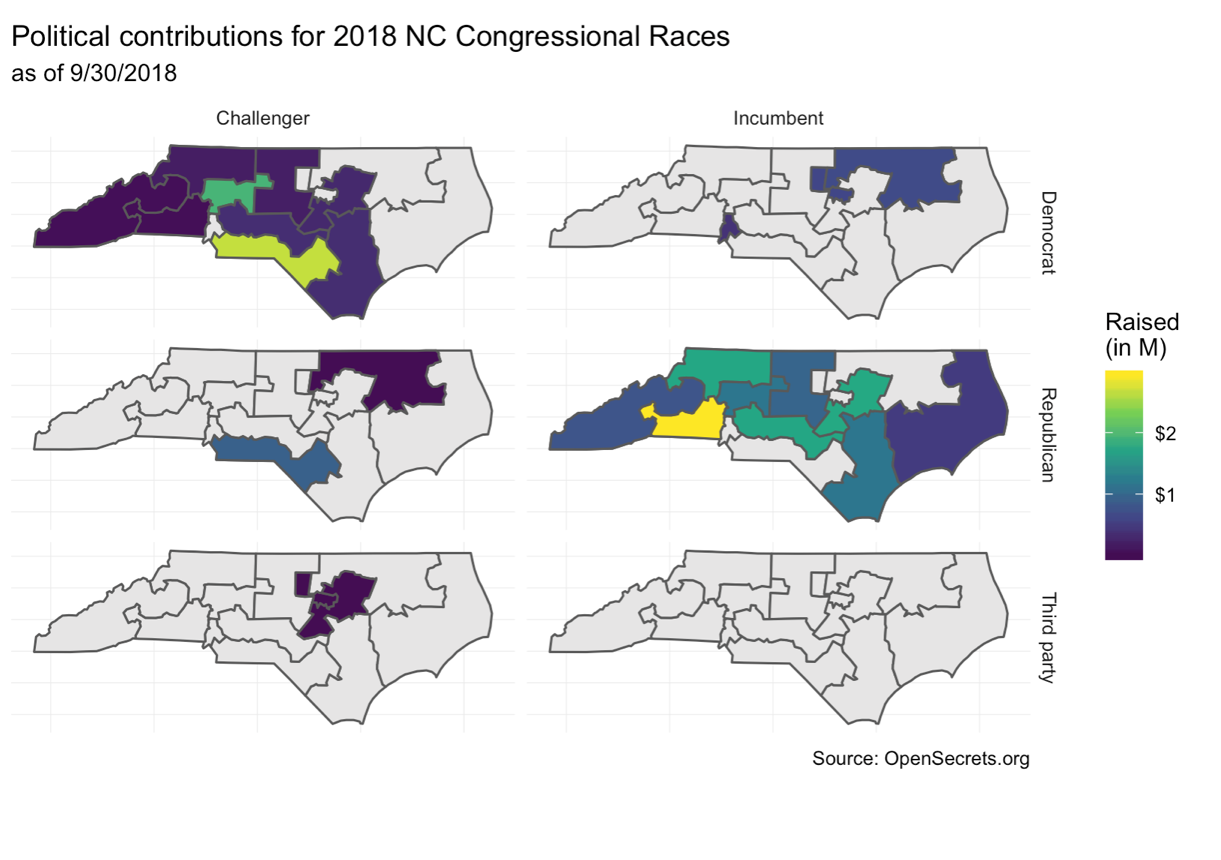
Today we’re going to do web scraping
- Using the rvest package
- And with the help of regular expressions
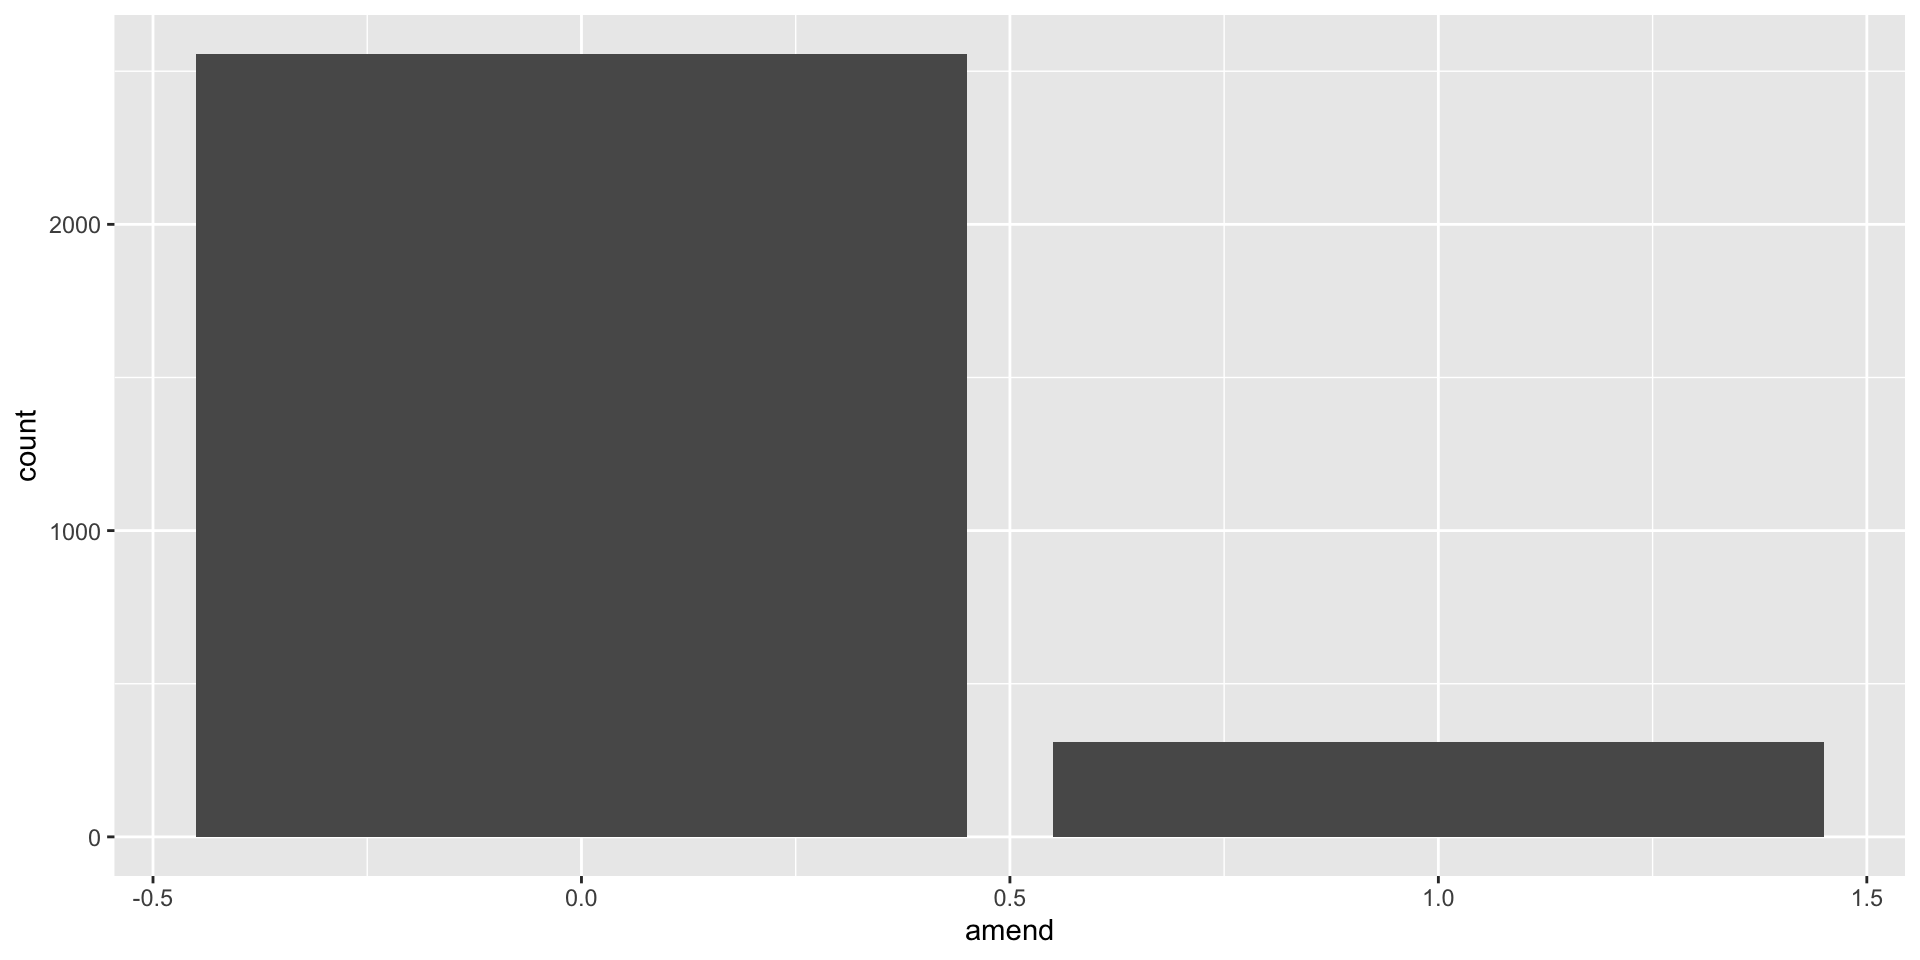
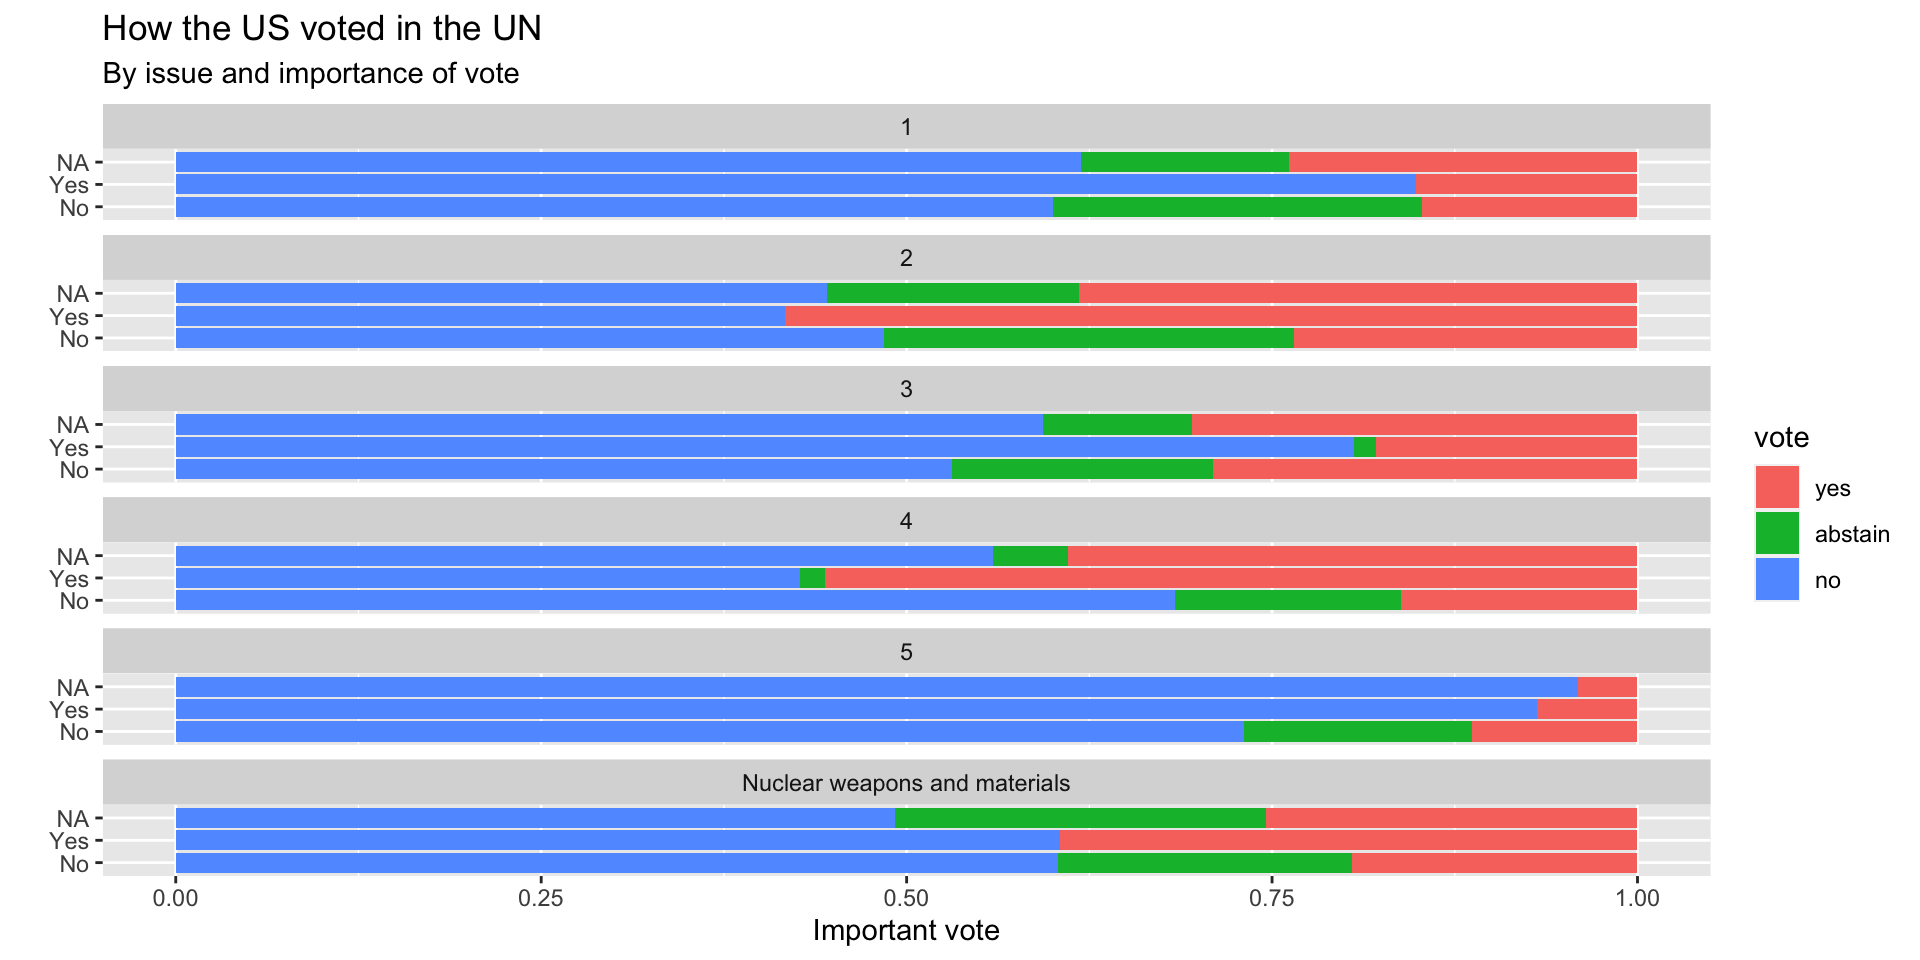
- Today we go from this to that
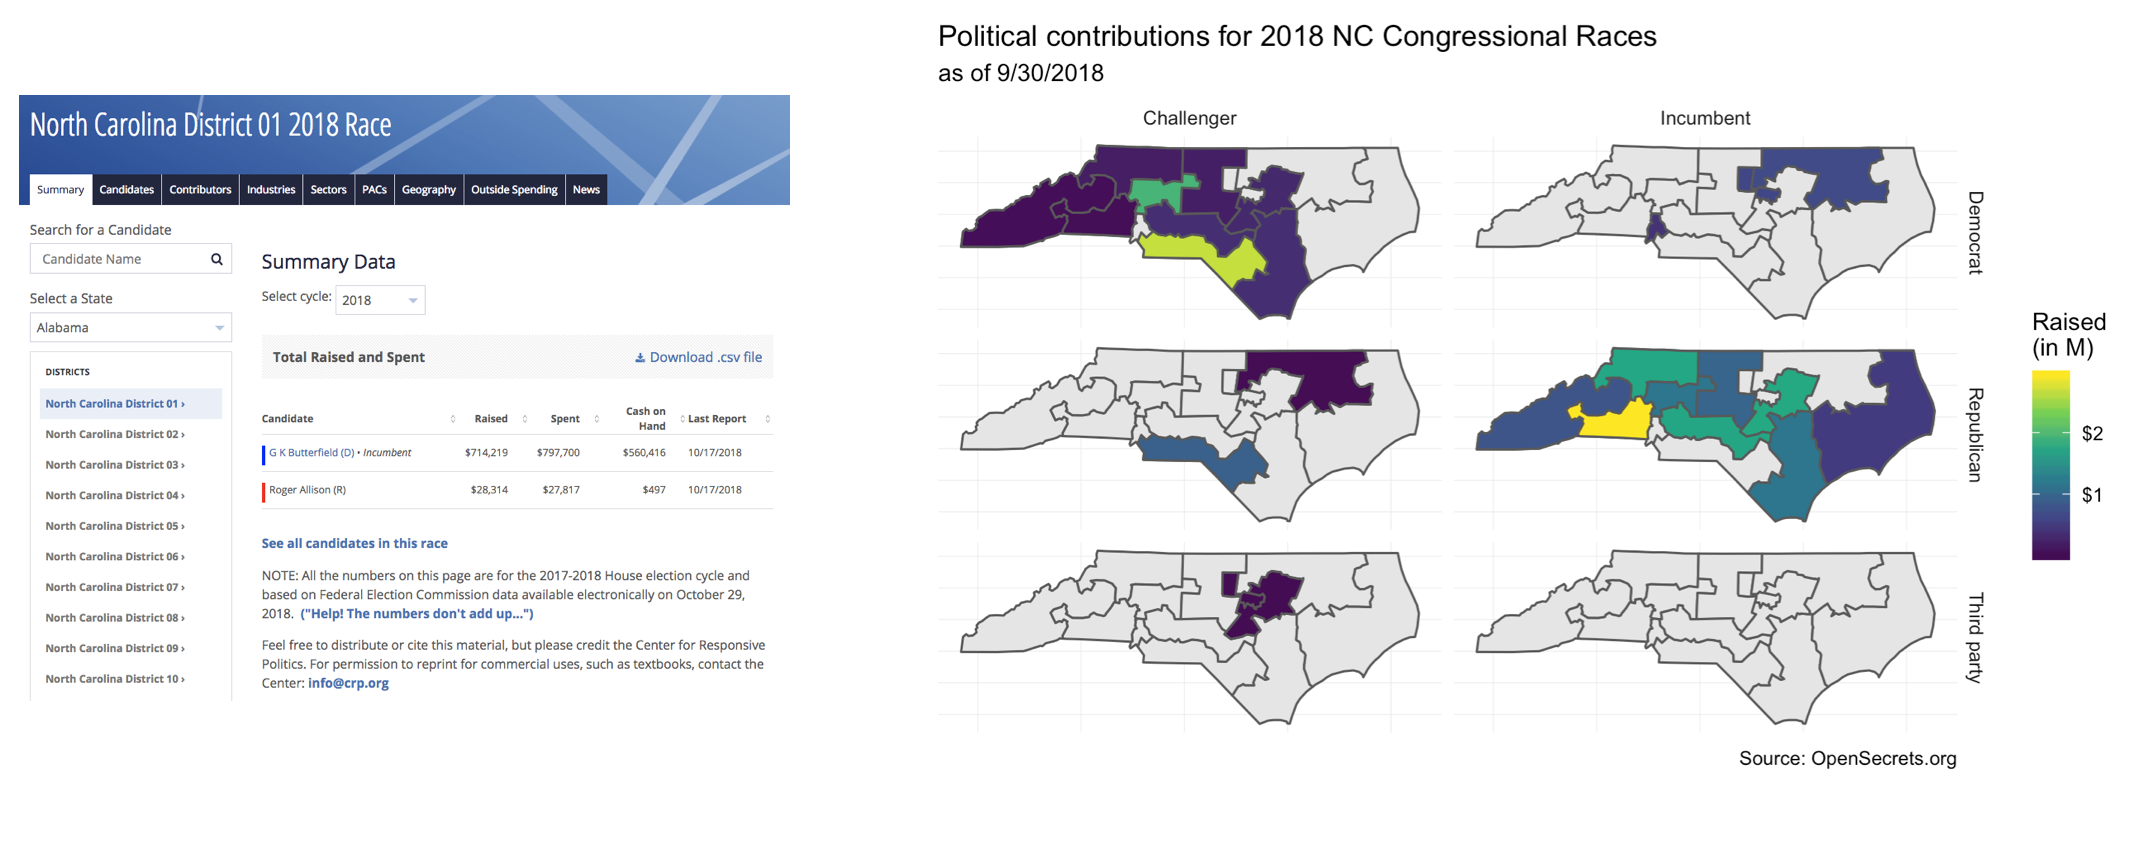
- and do so in a way that is easy to replicate for another state
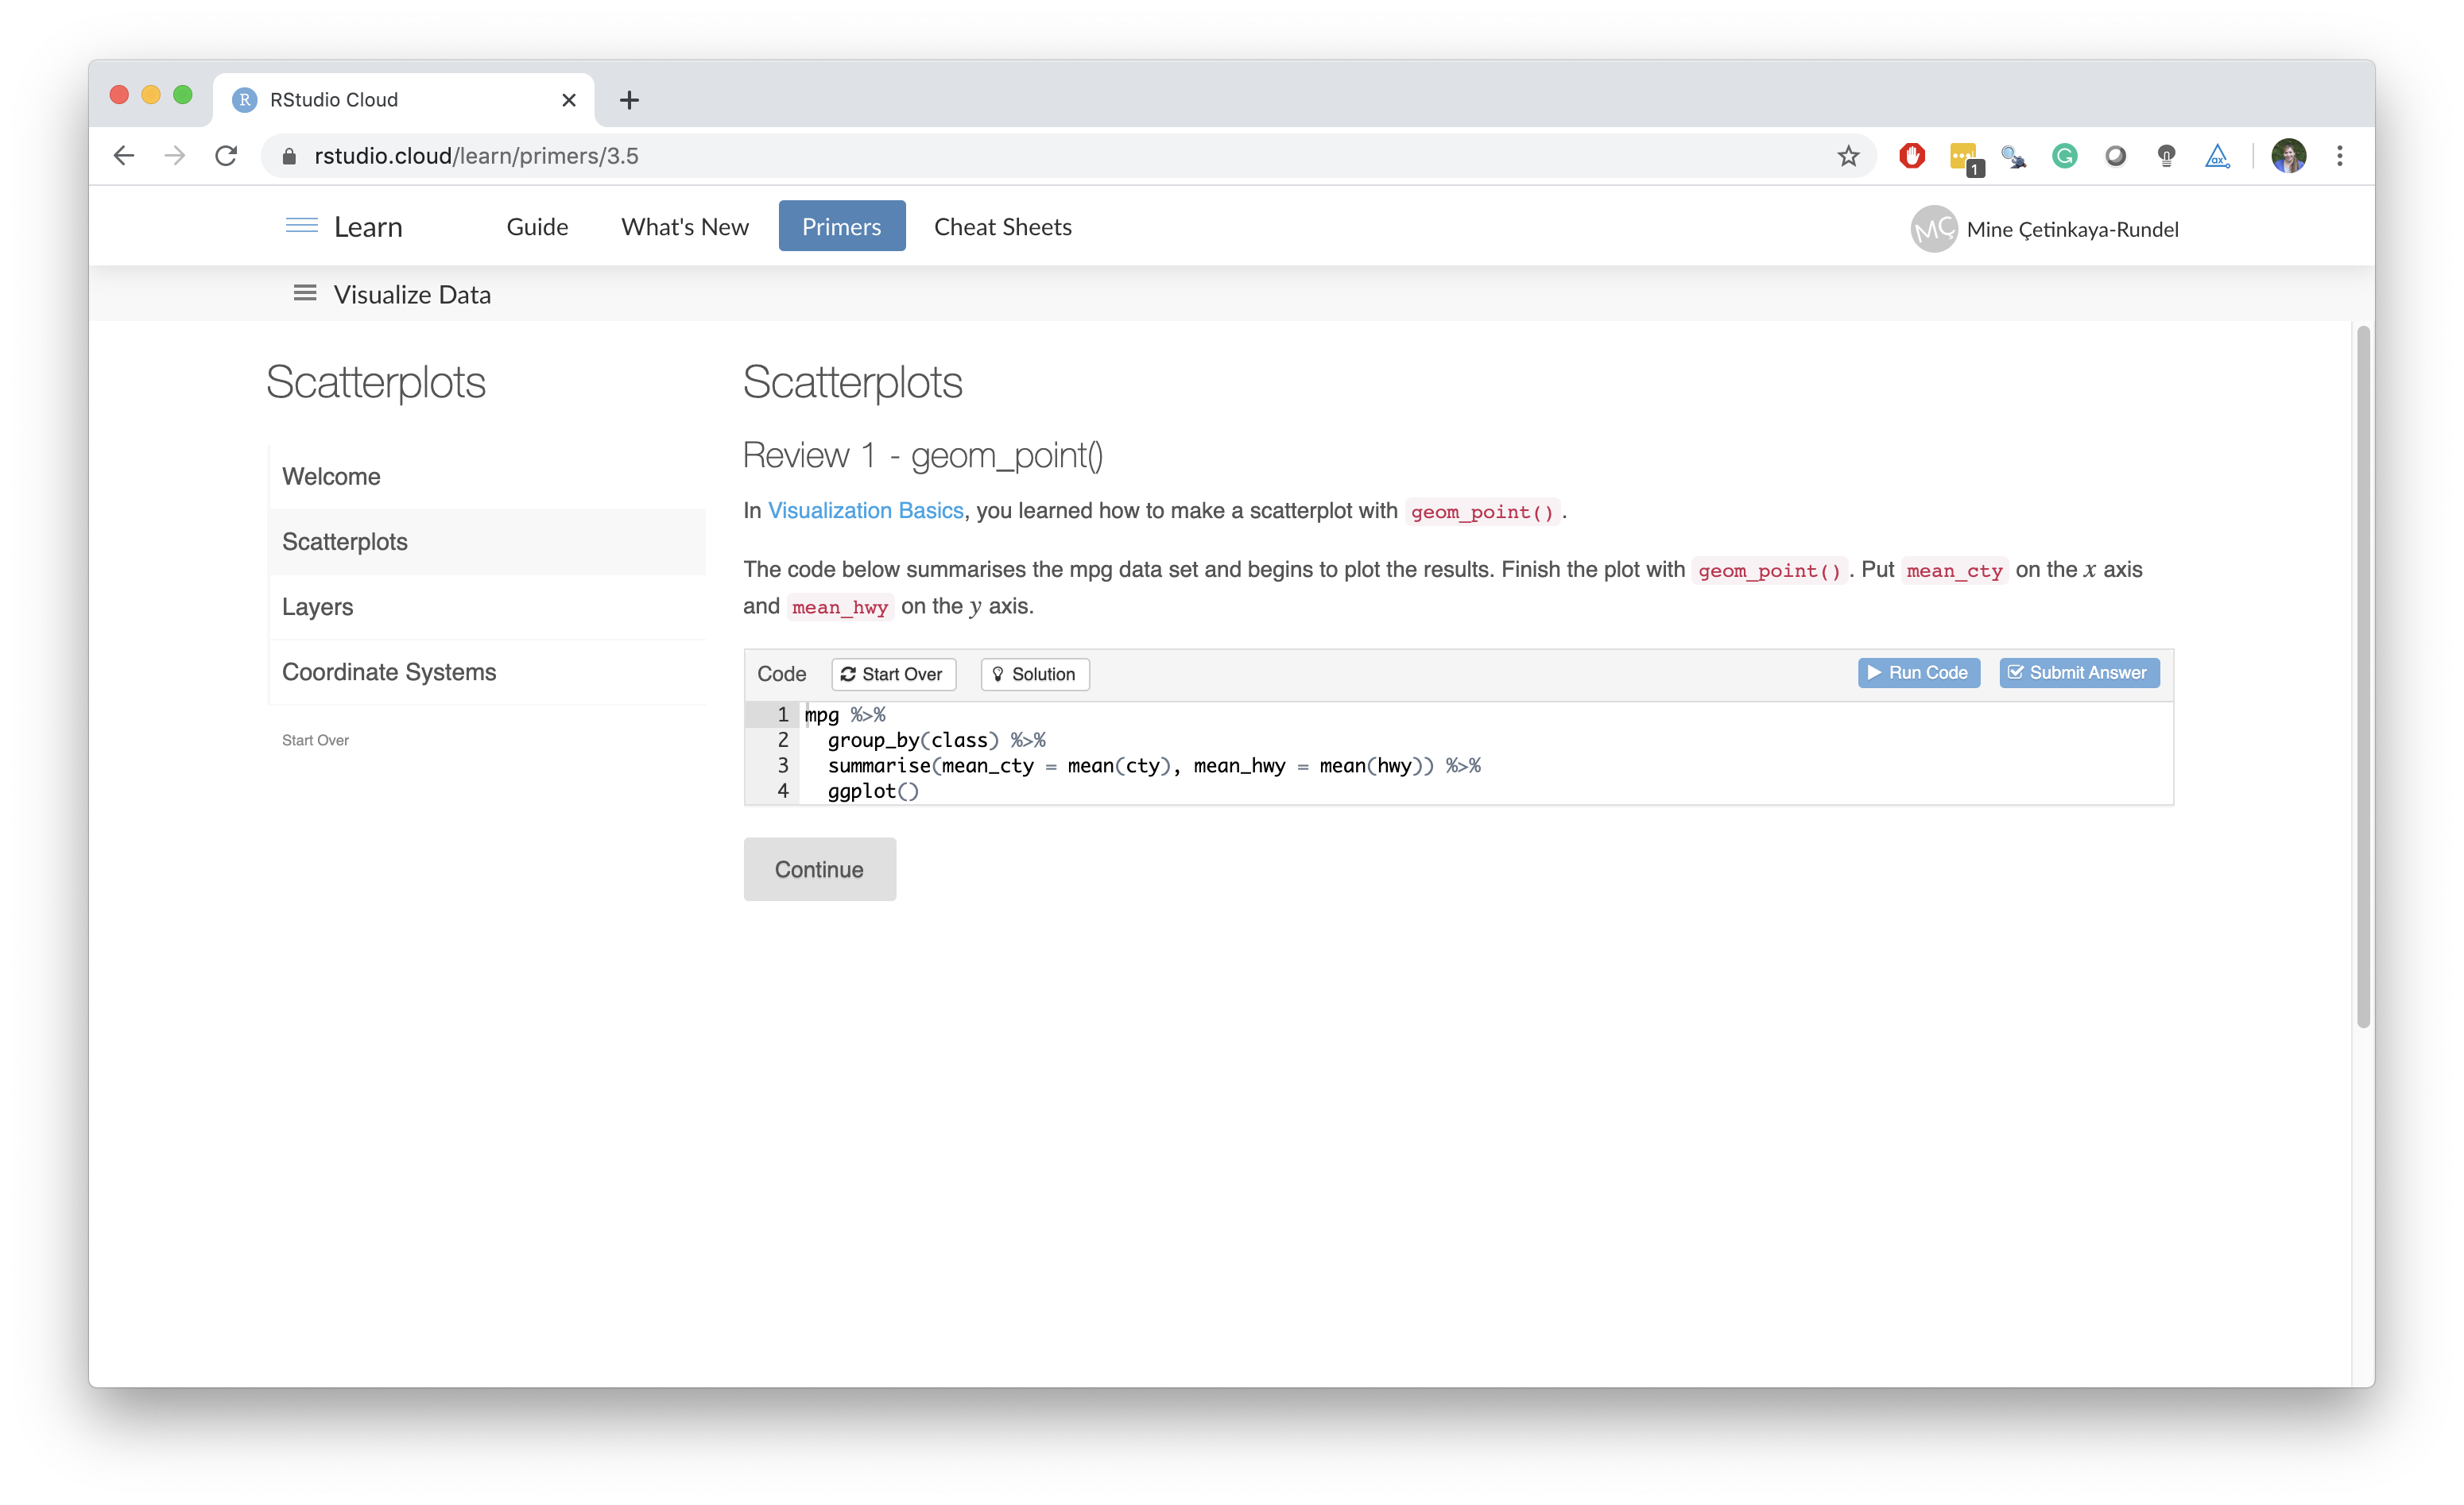
Follow up with a hands-on exercise
- Lesson: Web scraping essentials for turning a structured table into a data frame in R.
- Ex 1: Scrape the table off the web and save as a data frame.
And a thought exercise
- Lesson: Web scraping essentials for turning a structured table into a data frame in R.
- Ex 1: Scrape the table off the web and save as a data frame.
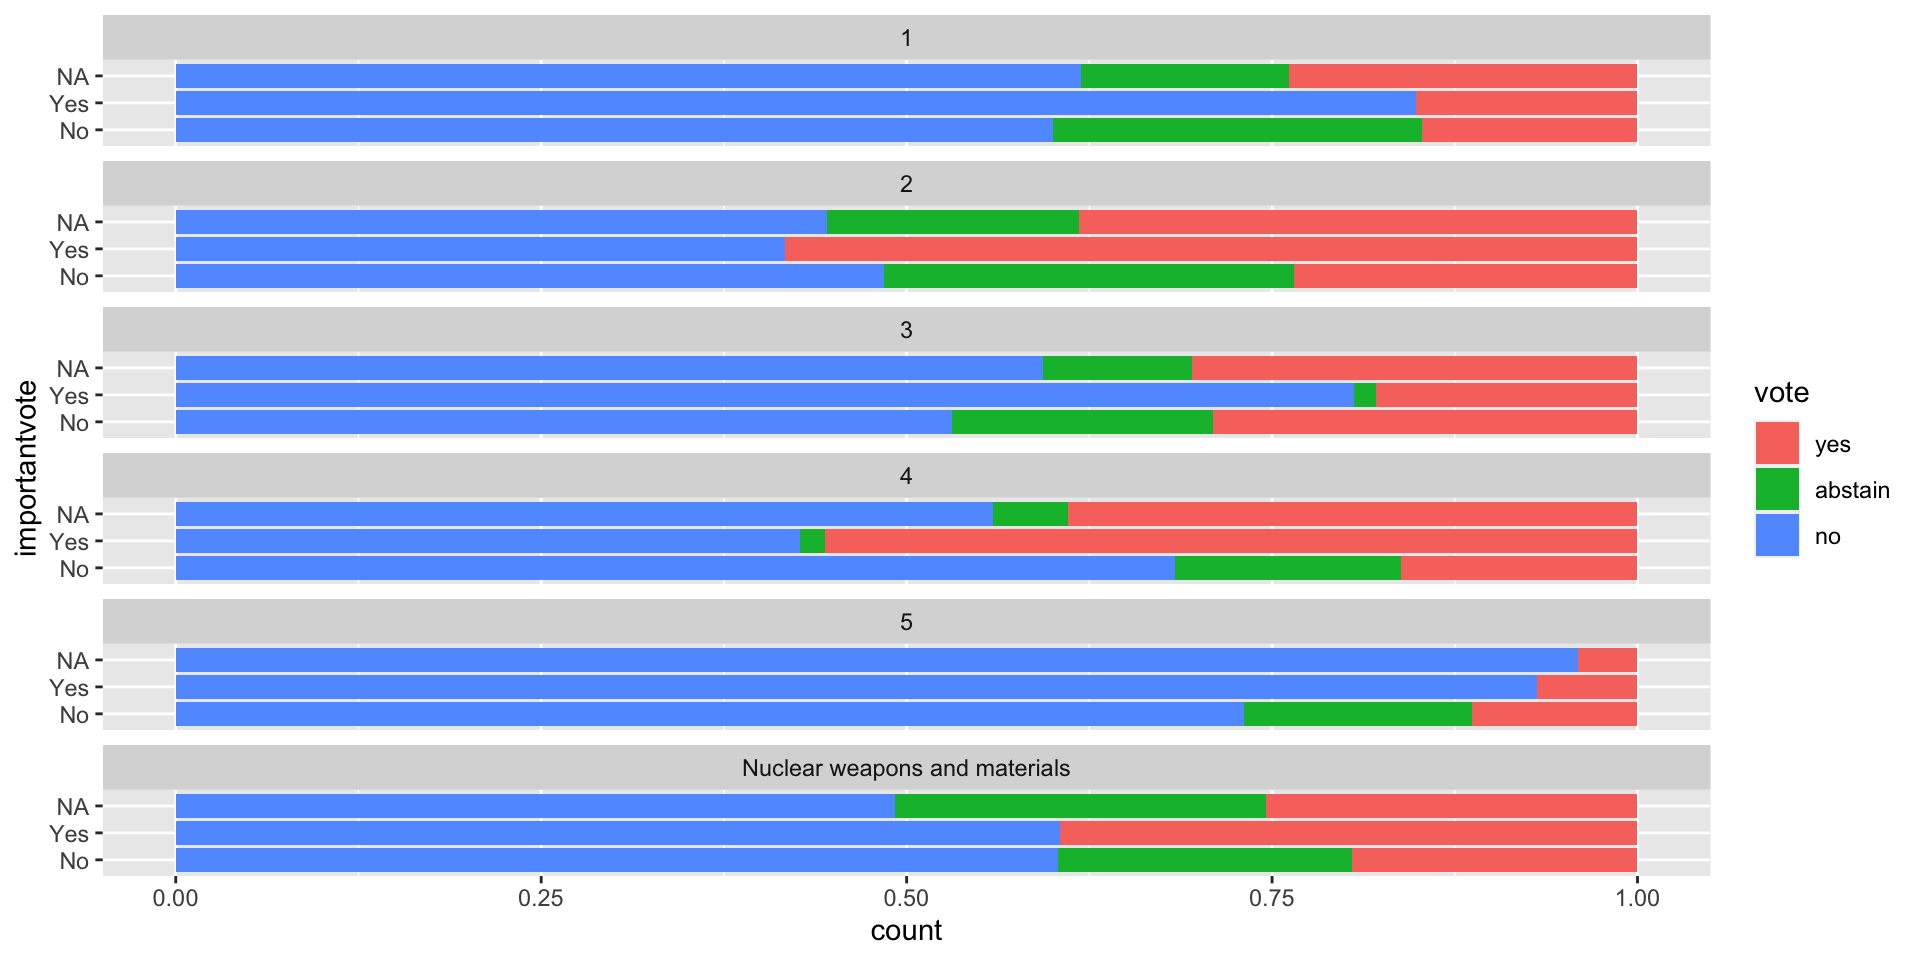
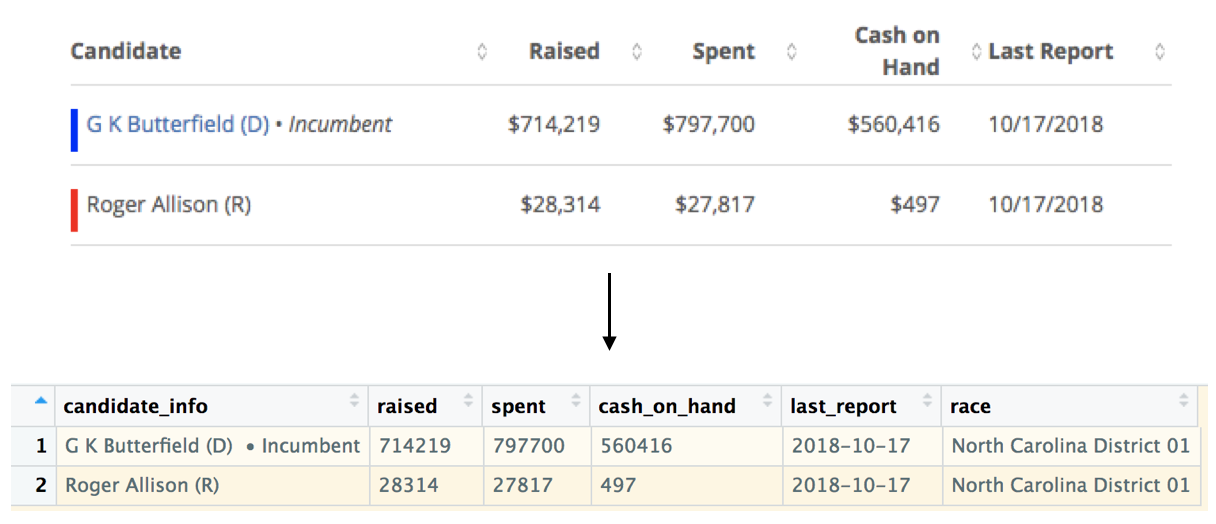
- Ex 2: What other information do we need represented as variables in the data to obtain the desired facets?
And finally, the veggies!
- Lesson: Web scraping essentials for turning a structured table into a data frame in R.
- Ex 1: Scrape the table off the web and save as a data frame.
- Ex 2: What other information do we need represented as variables in the data to obtain the desired facets?
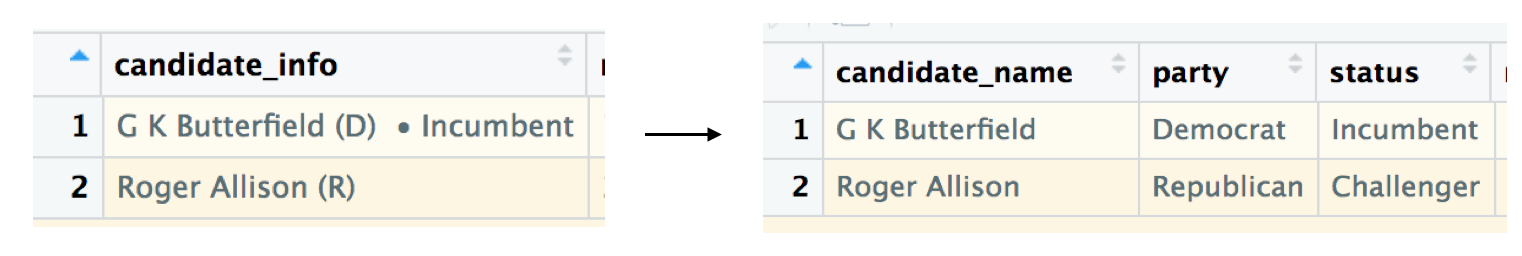
- Lesson: “Just enough” string parsing and regular expressions to go from
If you are already taking a baking class, which will be easier to venture on to?

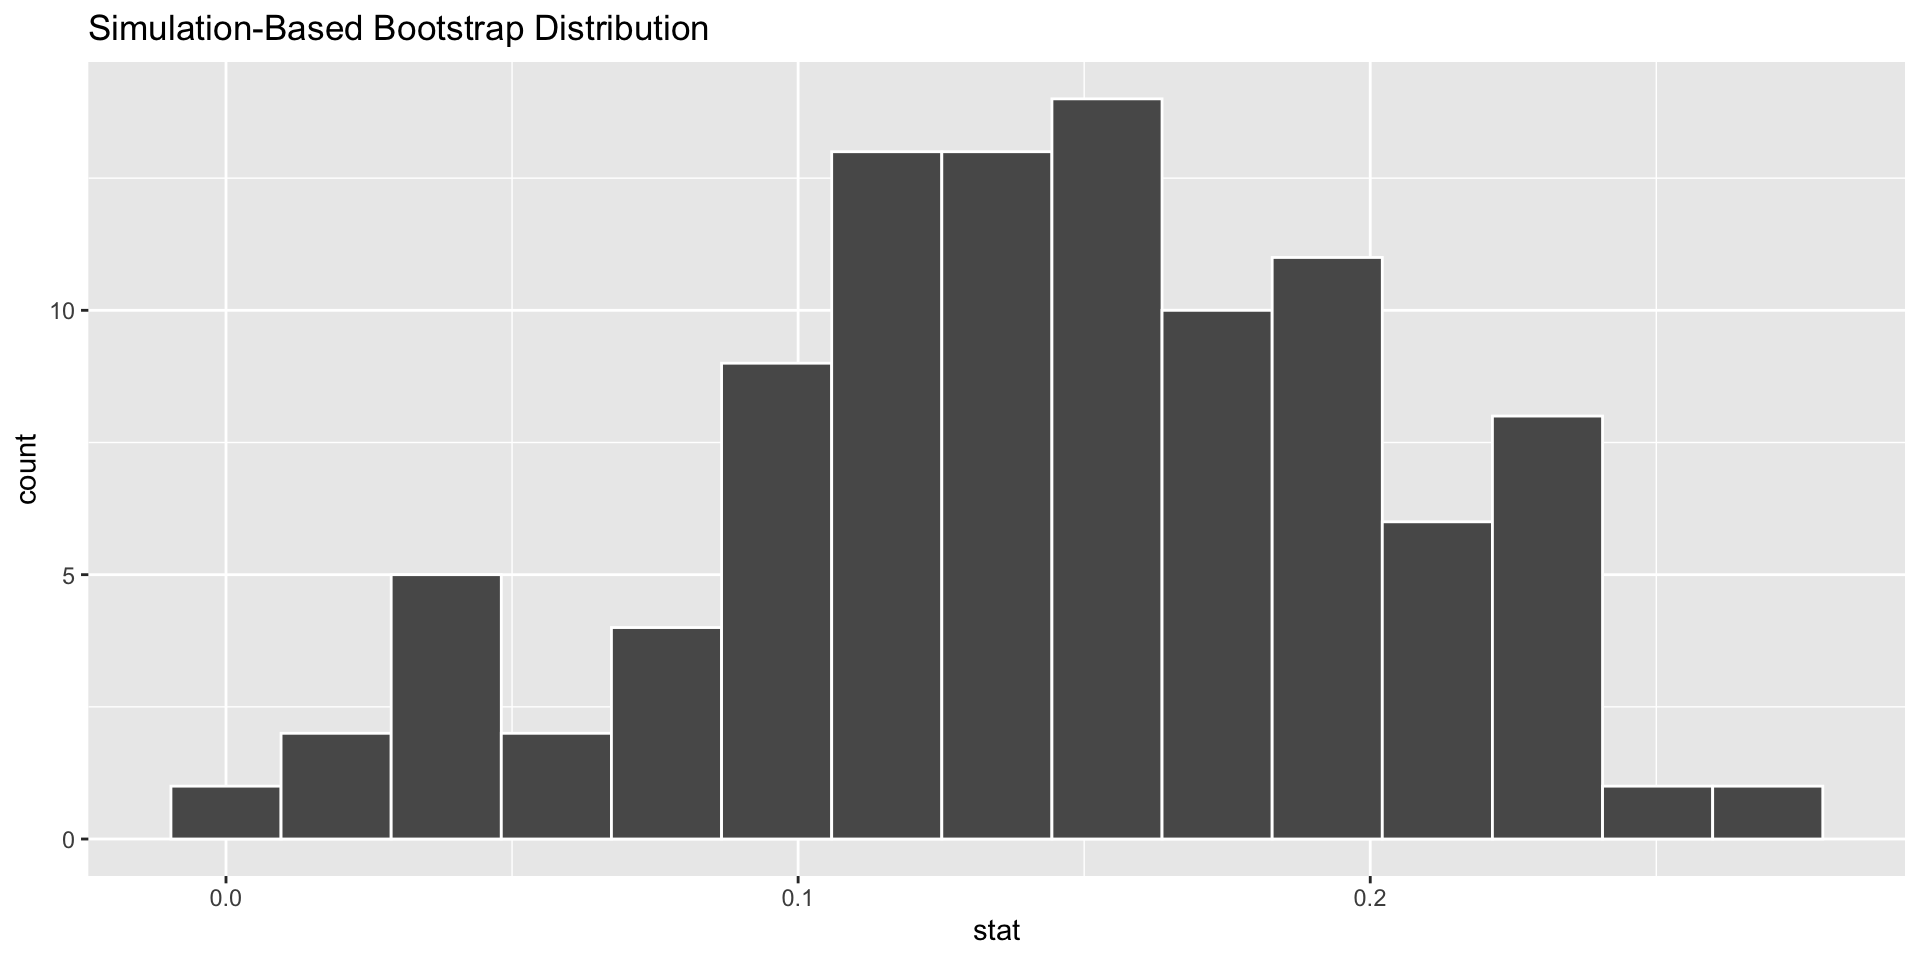
infer \(\in\) tidymodels
The objective of this package is to perform statistical inference using an expressive statistical grammar that coheres with the tidyverse design framework.
infer 4
One other way to “leverage the ecosystem”
Do it all in R!
- Slides, course, course notes / textbook with Quarto
- A student dashboard with flexdashboard
- Git automation with ghclass
- Interactive tutorials with learnr
- …